S&P Performance Adjusted for Debasement
Why your portfolio feels like it's winning, but your purchasing power is standing still
I’m sure you’ve heard of the term adjusted for inflation. But have you heard about the term adjusted for debasement? Probably never, and that’s because the picture is quite depressing. Let’s run through an example:
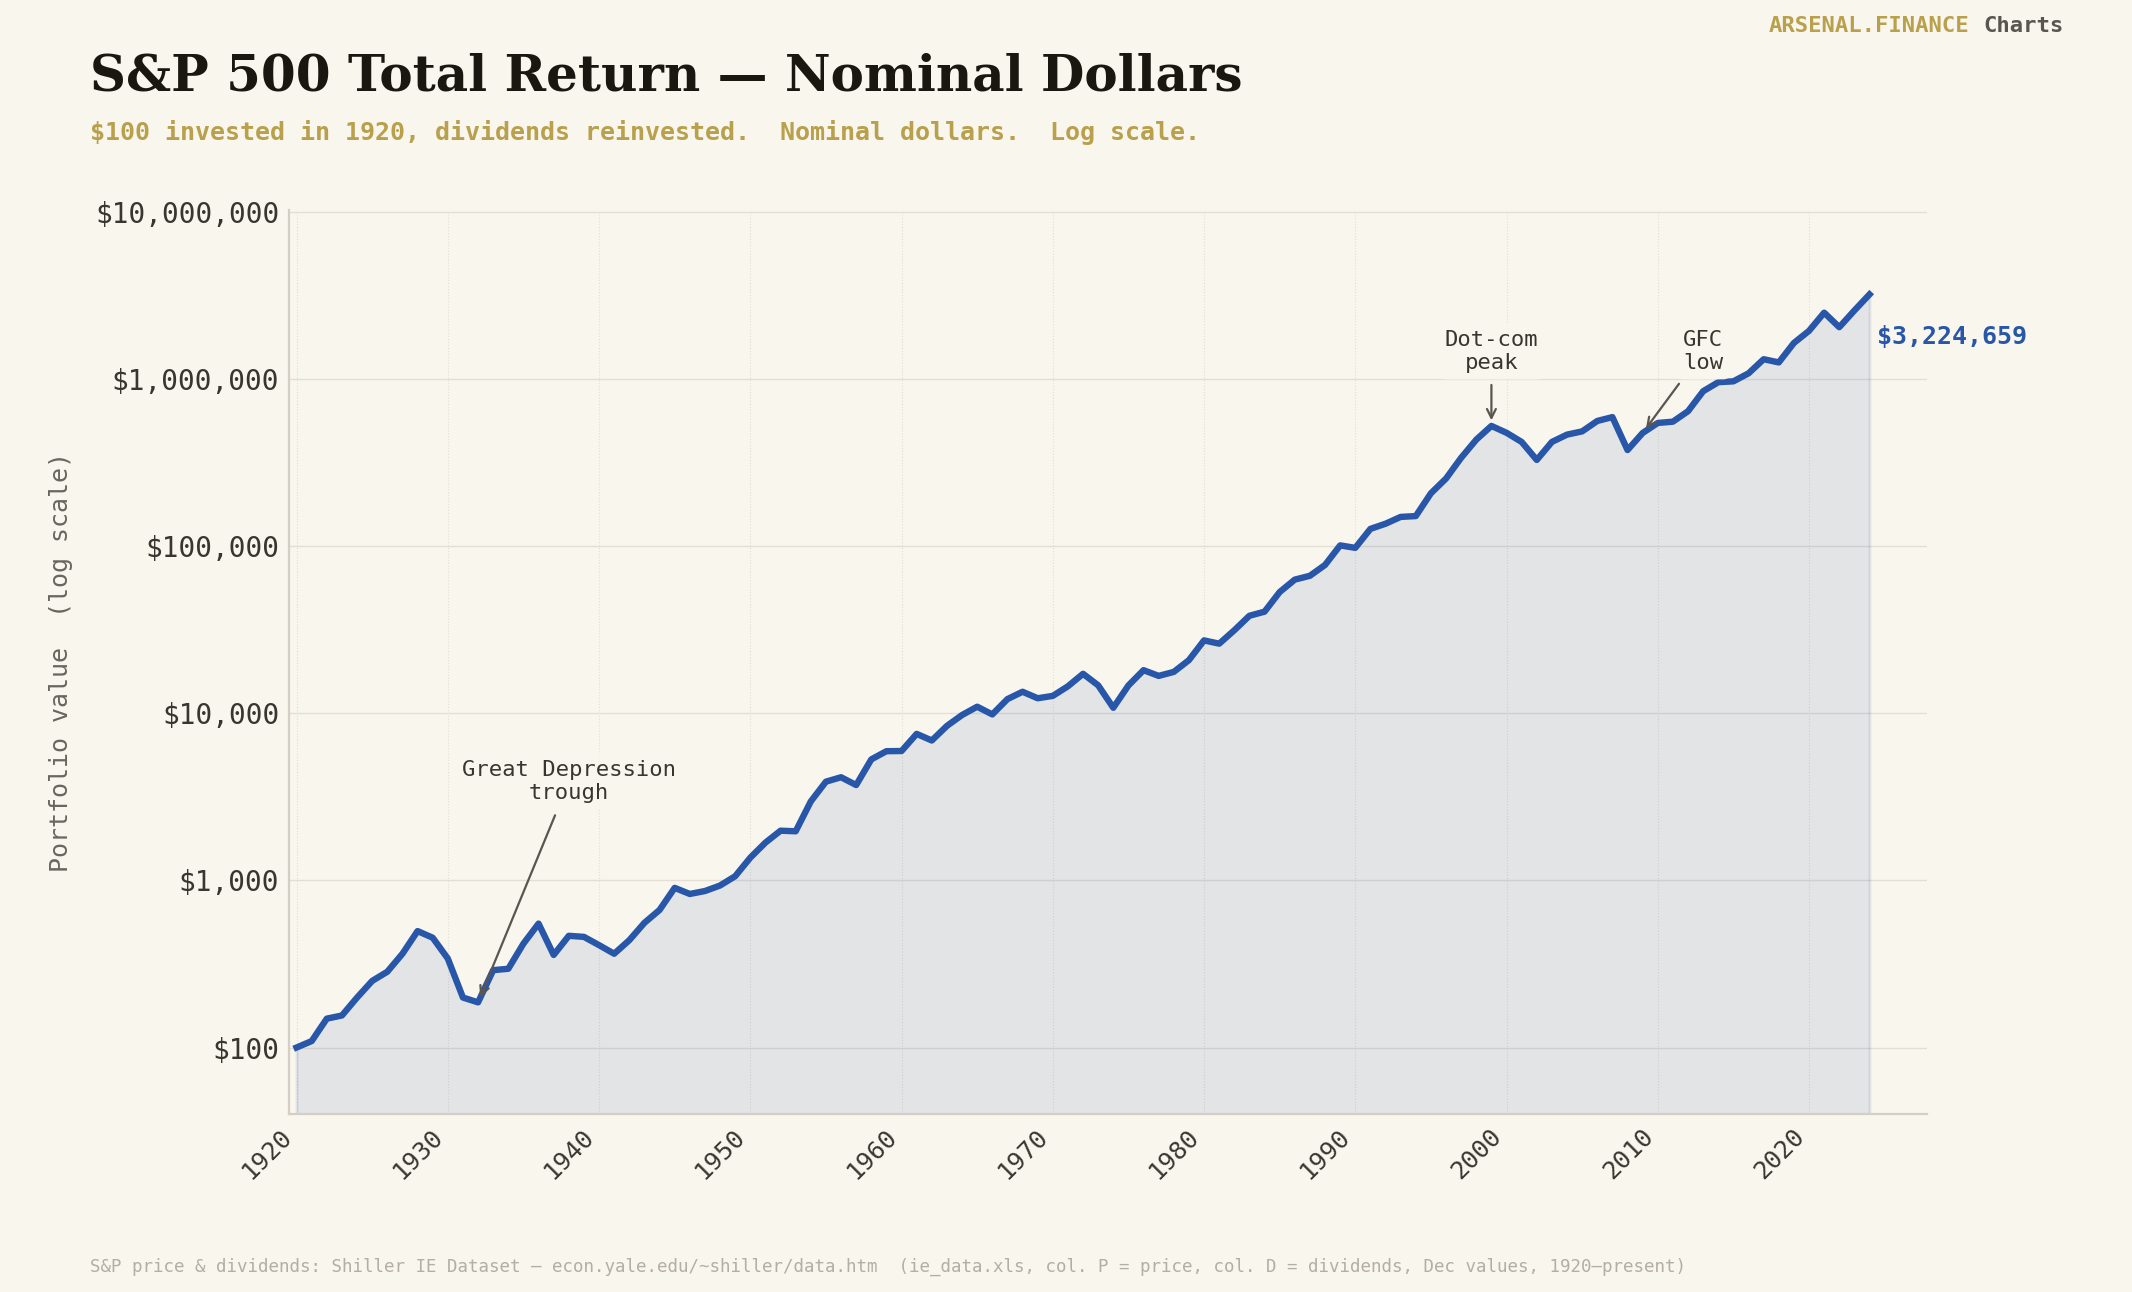
The following chart is the S&P500 total return since 1920 in nominal terms. Looks great.
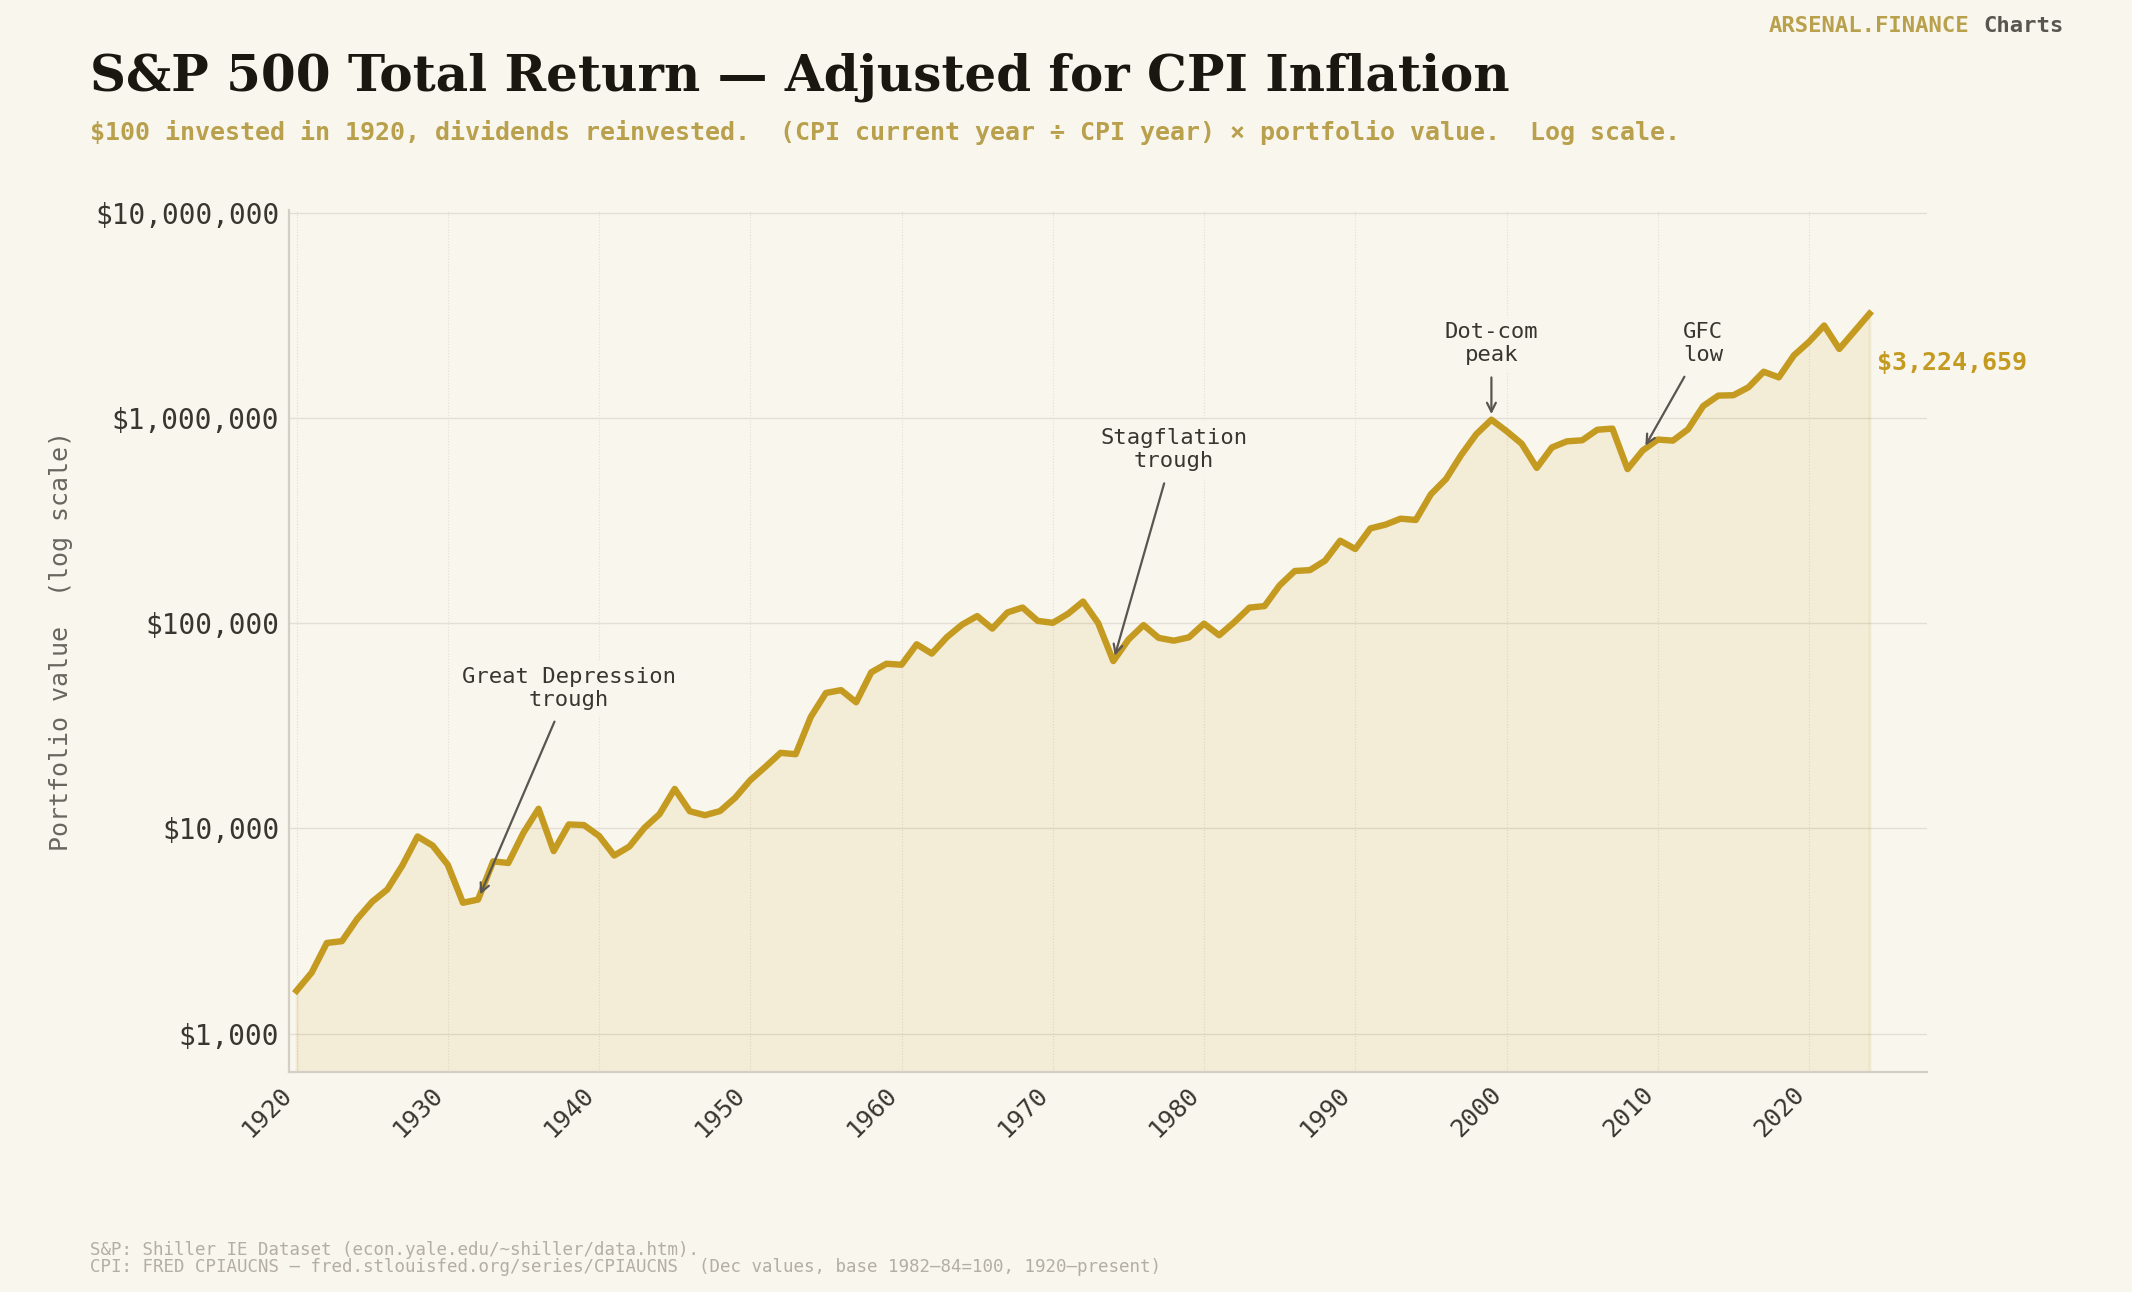
Now below is the same chart but adjusted to inflation. The methodology is simple for anyone to understand: You divide current CPI level by the CPI level at each given year and multiply that number by the nominal price of the S&P500 at each given year. This brings prices to today’s dollar terms. If a good is $21 today but it was $3 thirty years ago, then all other prices must be multiplied by 7 to understand it in current terms. That’s the logic, yes “we are richer” today because many goods have become cheaper; I don’t buy it but we are not getting into that discussion in this article.
Now let’s take it one step further. The chart below is yet again the same S&P500 total return chart but using M2 as the adjuster instead of inflation. M2 is the “total amount of cash” in the system, basically all bank accounts combined. Same methodology as before.
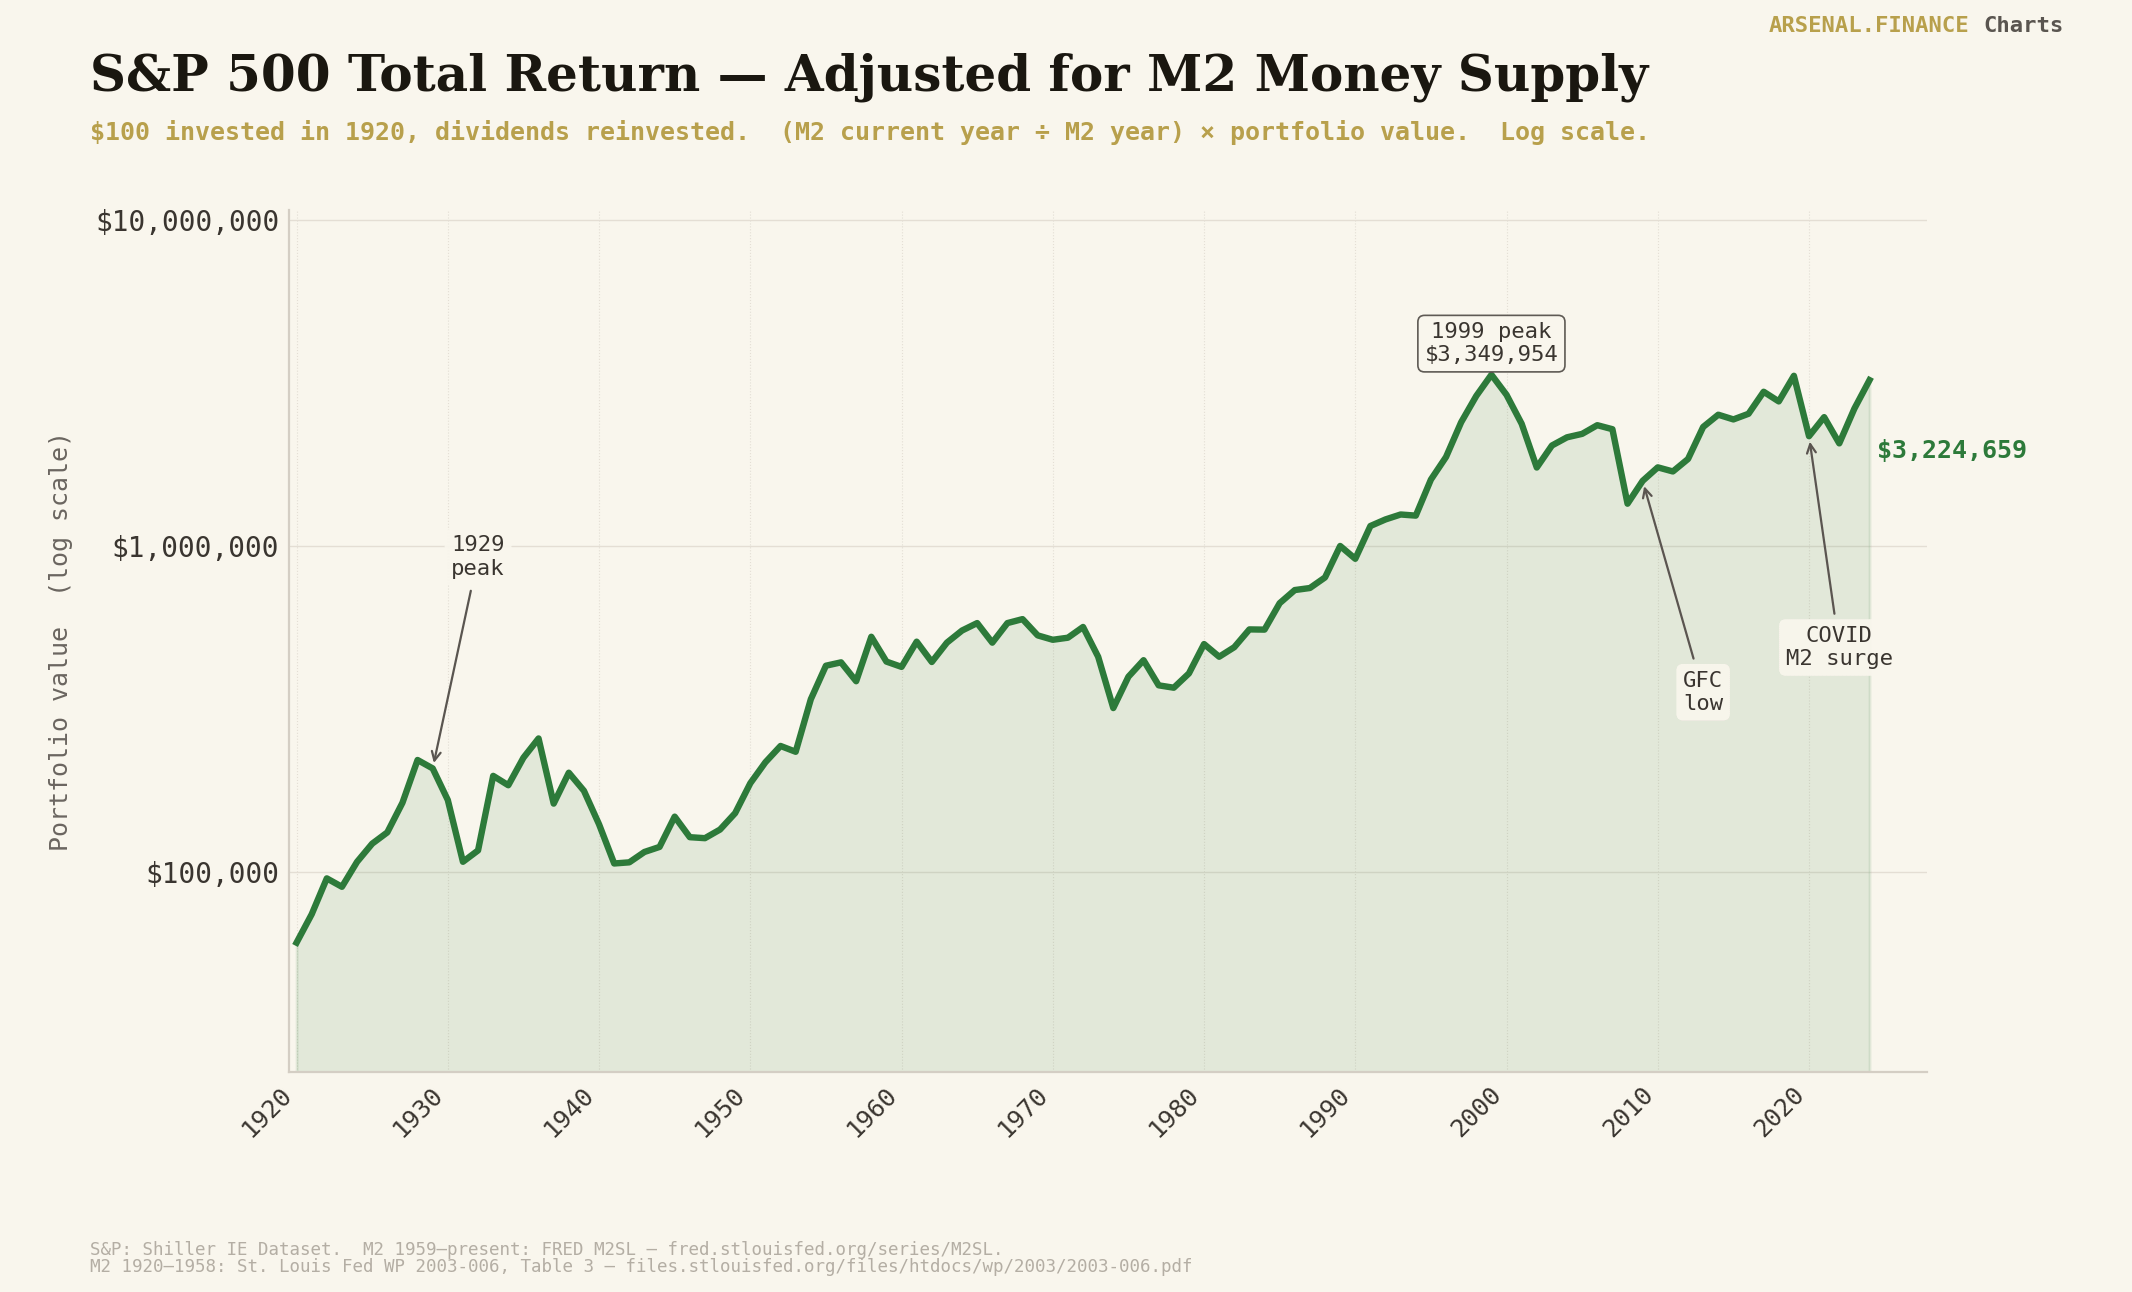
The picture becomes more depressing. The S&P500 is no longer that straight line upwards as we imagine it. Now M2 has a slight problem since money is essentially multiplied many times over since the money you have in your bank account is actually partially being lent out by the bank and later deposited again in a bank by someone else. So lets use the total Monetary Base or simple total amount of money printed in circulation instead.
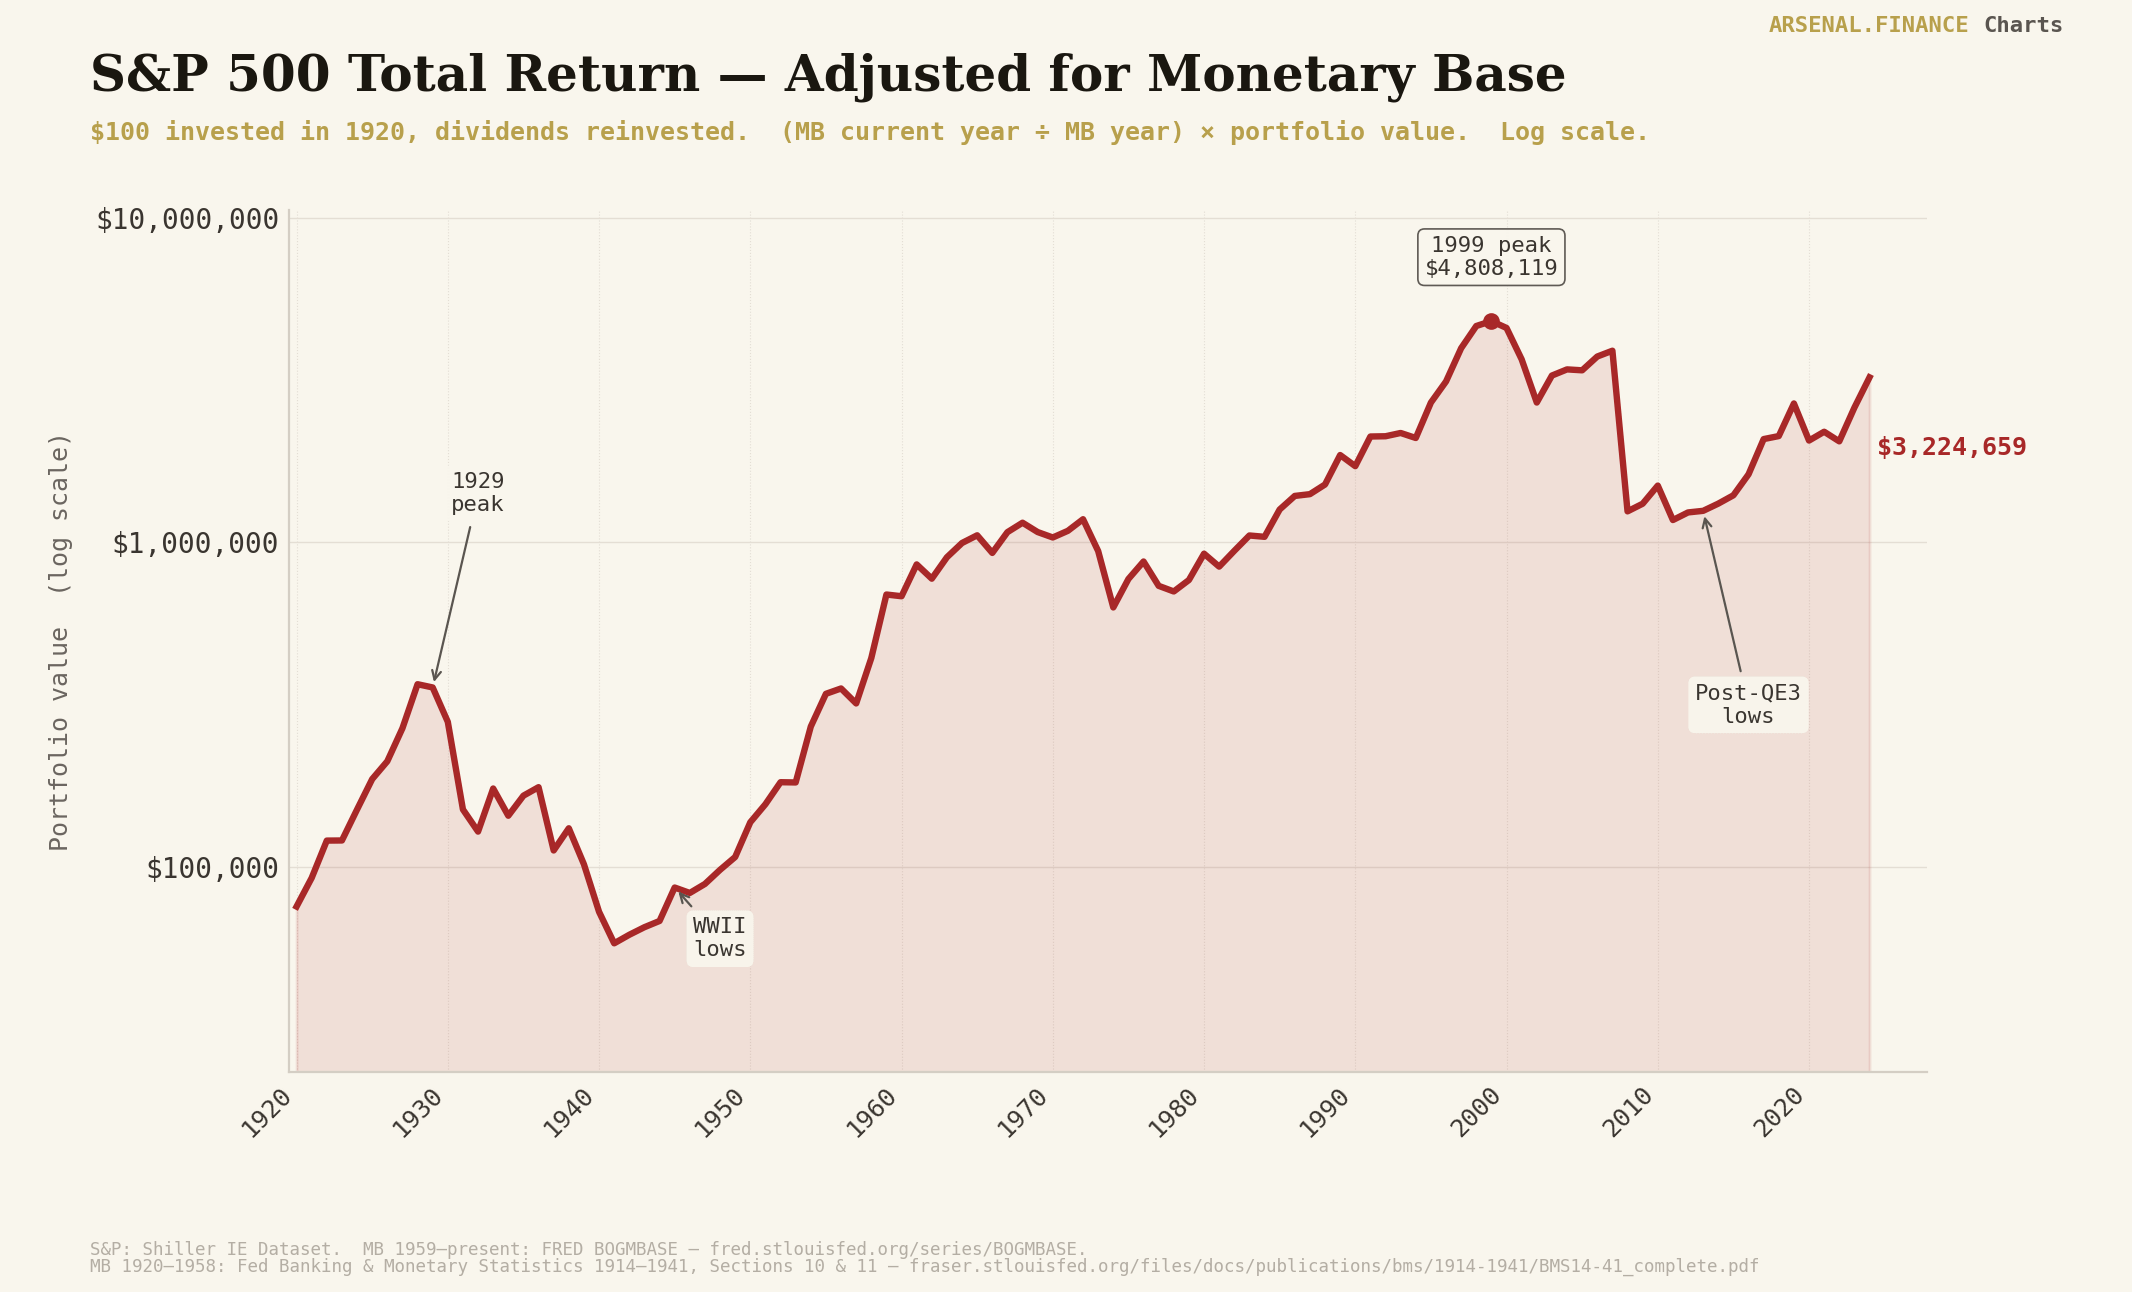
What do we see? That in actual purchasing power terms, the stock market is at the same level today than in the late 1990s. Why? Because the market crashes of 2000 and 2008 were so big and the Fed interventions in the form of Open Market Operations and Quantitative Easing (ahem, money printing don’t let them fool ya...) that followed were so massive that the stock market has not been able to catch up. You are as rich now as you were in the late 1990s if fully invested in the stock market in real real terms. This is why you don’t feel any richer.
You could interpret this a case for gold but the reality is that stocks over the very long run have outperformed all other assets including gold, bonds, and real estate after adjusting for debasement. The true moral of the story is that investors lose when governments print money excessively, and it is important to understand where you stand in history.
Disclaimer: The information above provided by Arsenal.Finance is for educational and informational purposes only and should not be construed as investment, financial, or legal advice. I am not a financial advisor. All investments involve risk, and the past performance of a security or financial product does not guarantee future results or returns. Always conduct your own research or consult with a professional before making any financial decisions.