How to Hedge Like Bill Ackman
Keep most of the portfolio invested and compare the cost and benefit of each hedge. Bookmark this for future reference.
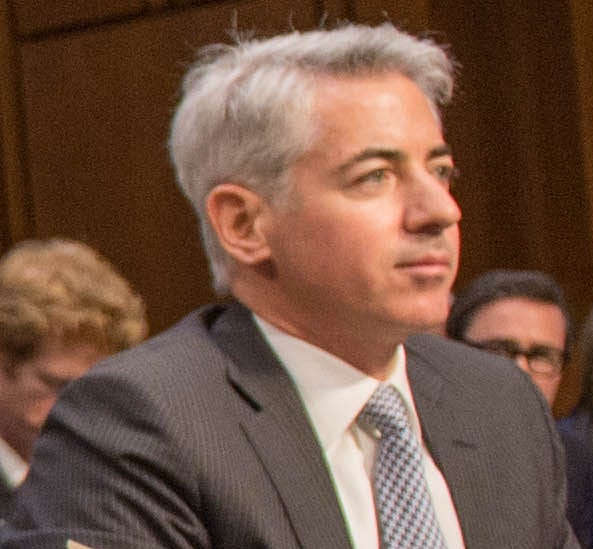
In February 2020, Bill Ackman liked the companies he owned but feared that coronavirus shutdowns would hurt their businesses. So Pershing Square kept its stocks and bought contracts protecting against companies failing to repay debt. As investors grew more worried, those contracts became more valuable and Ackman sold them to raise cash.
By March 23, Pershing Square had received $2.6 billion from the hedge after paying $27 million in premiums and commissions, and it used the proceeds to buy stocks. The $27 million was the cost paid during the trade, not a limit on what it could have lost if markets had moved against it.
Later in 2020, Ackman expected stimulus and reopening to bring inflation and earlier rate increases. So Pershing Square bought contracts designed to gain value as interest rates rose. Its February 2022 presentation reports $188 million spent, $1.252 billion received from selling most of those contracts, and another $134 million still held. That last amount had not yet been turned into cash.

We can follow the same principle with ETFs: keep most of the portfolio invested and add temporary protection for a specific risk. We cannot assume Ackman’s timing or extraordinary payoff.
Keep the stocks and bonds and add a hedge
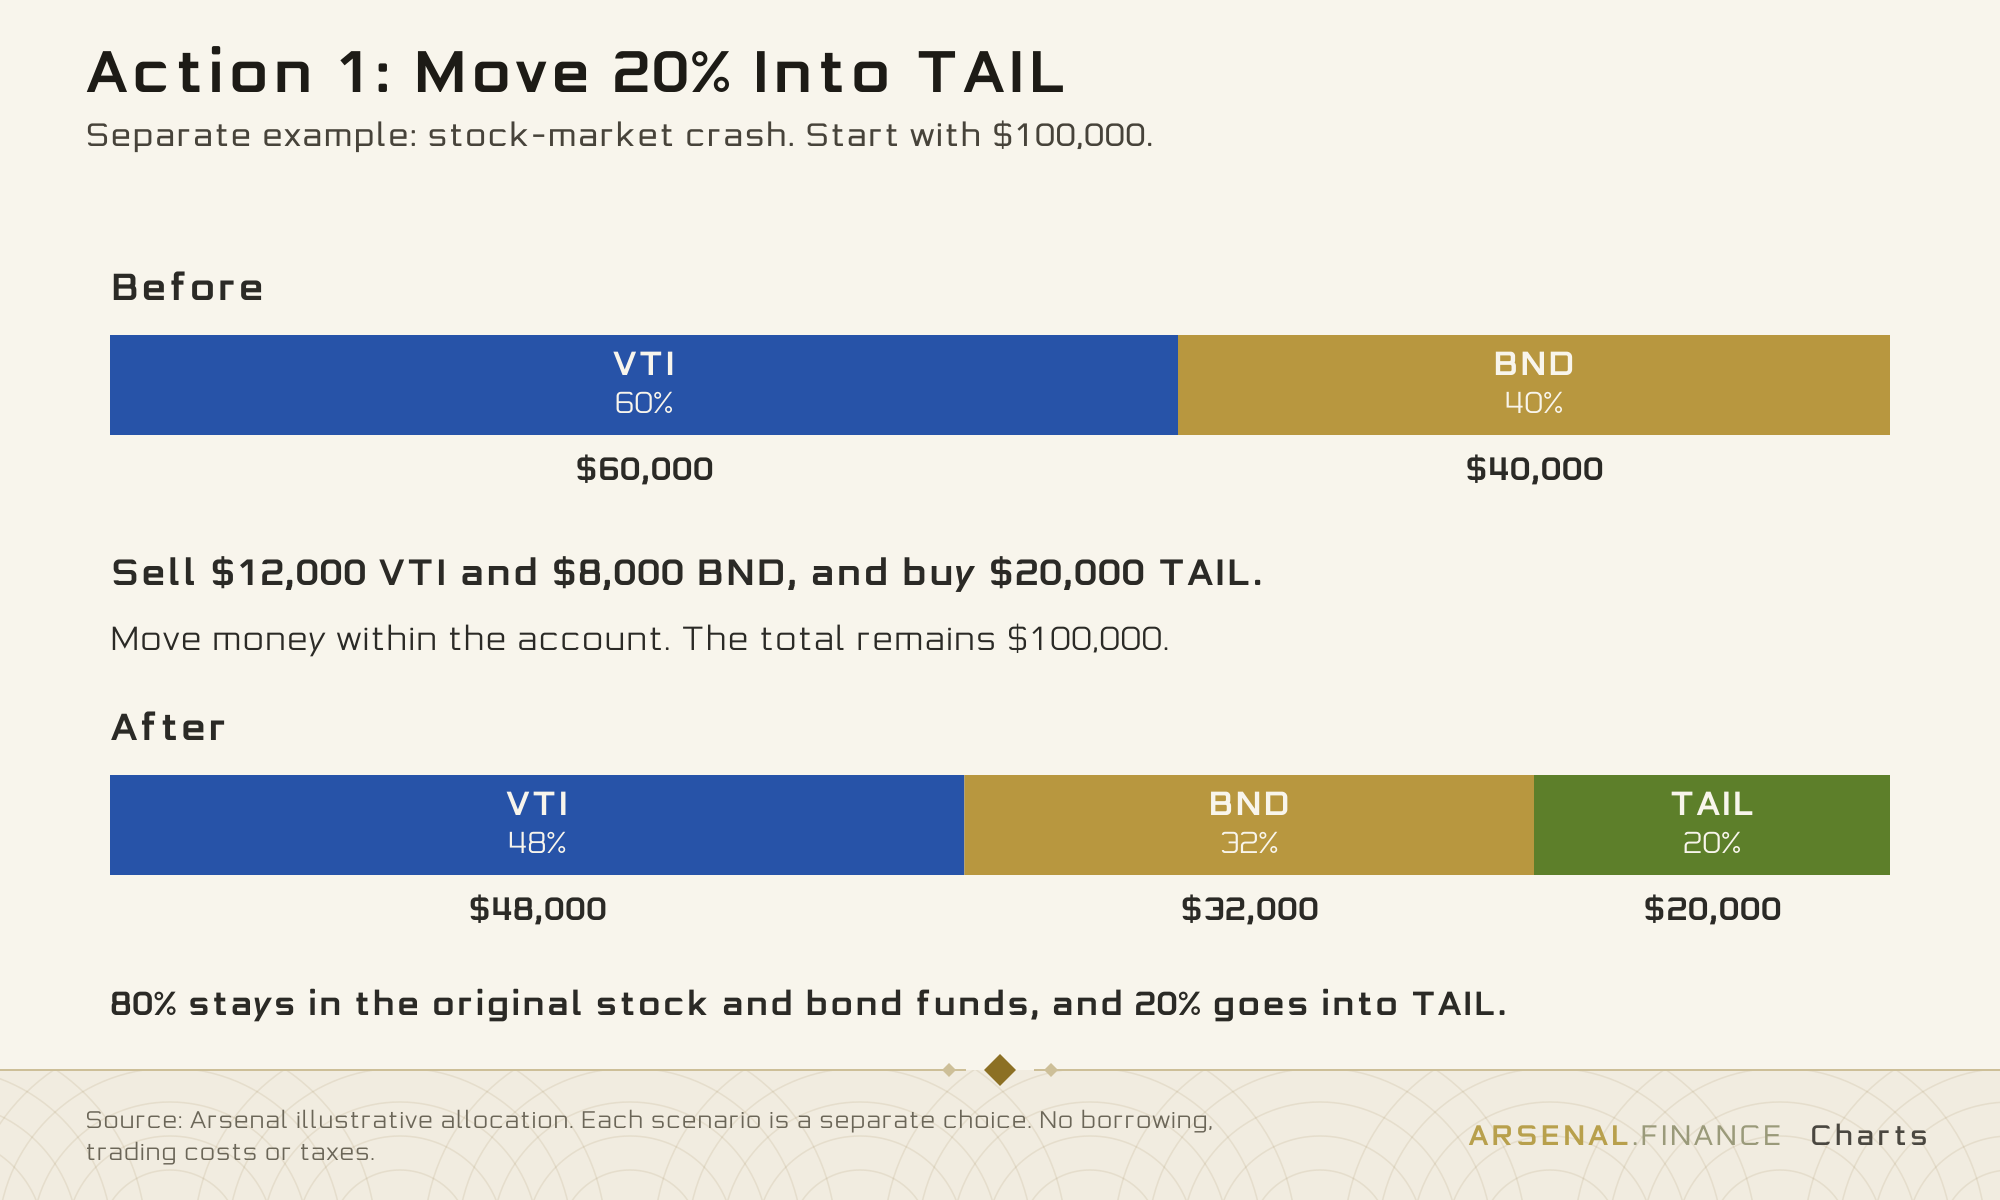
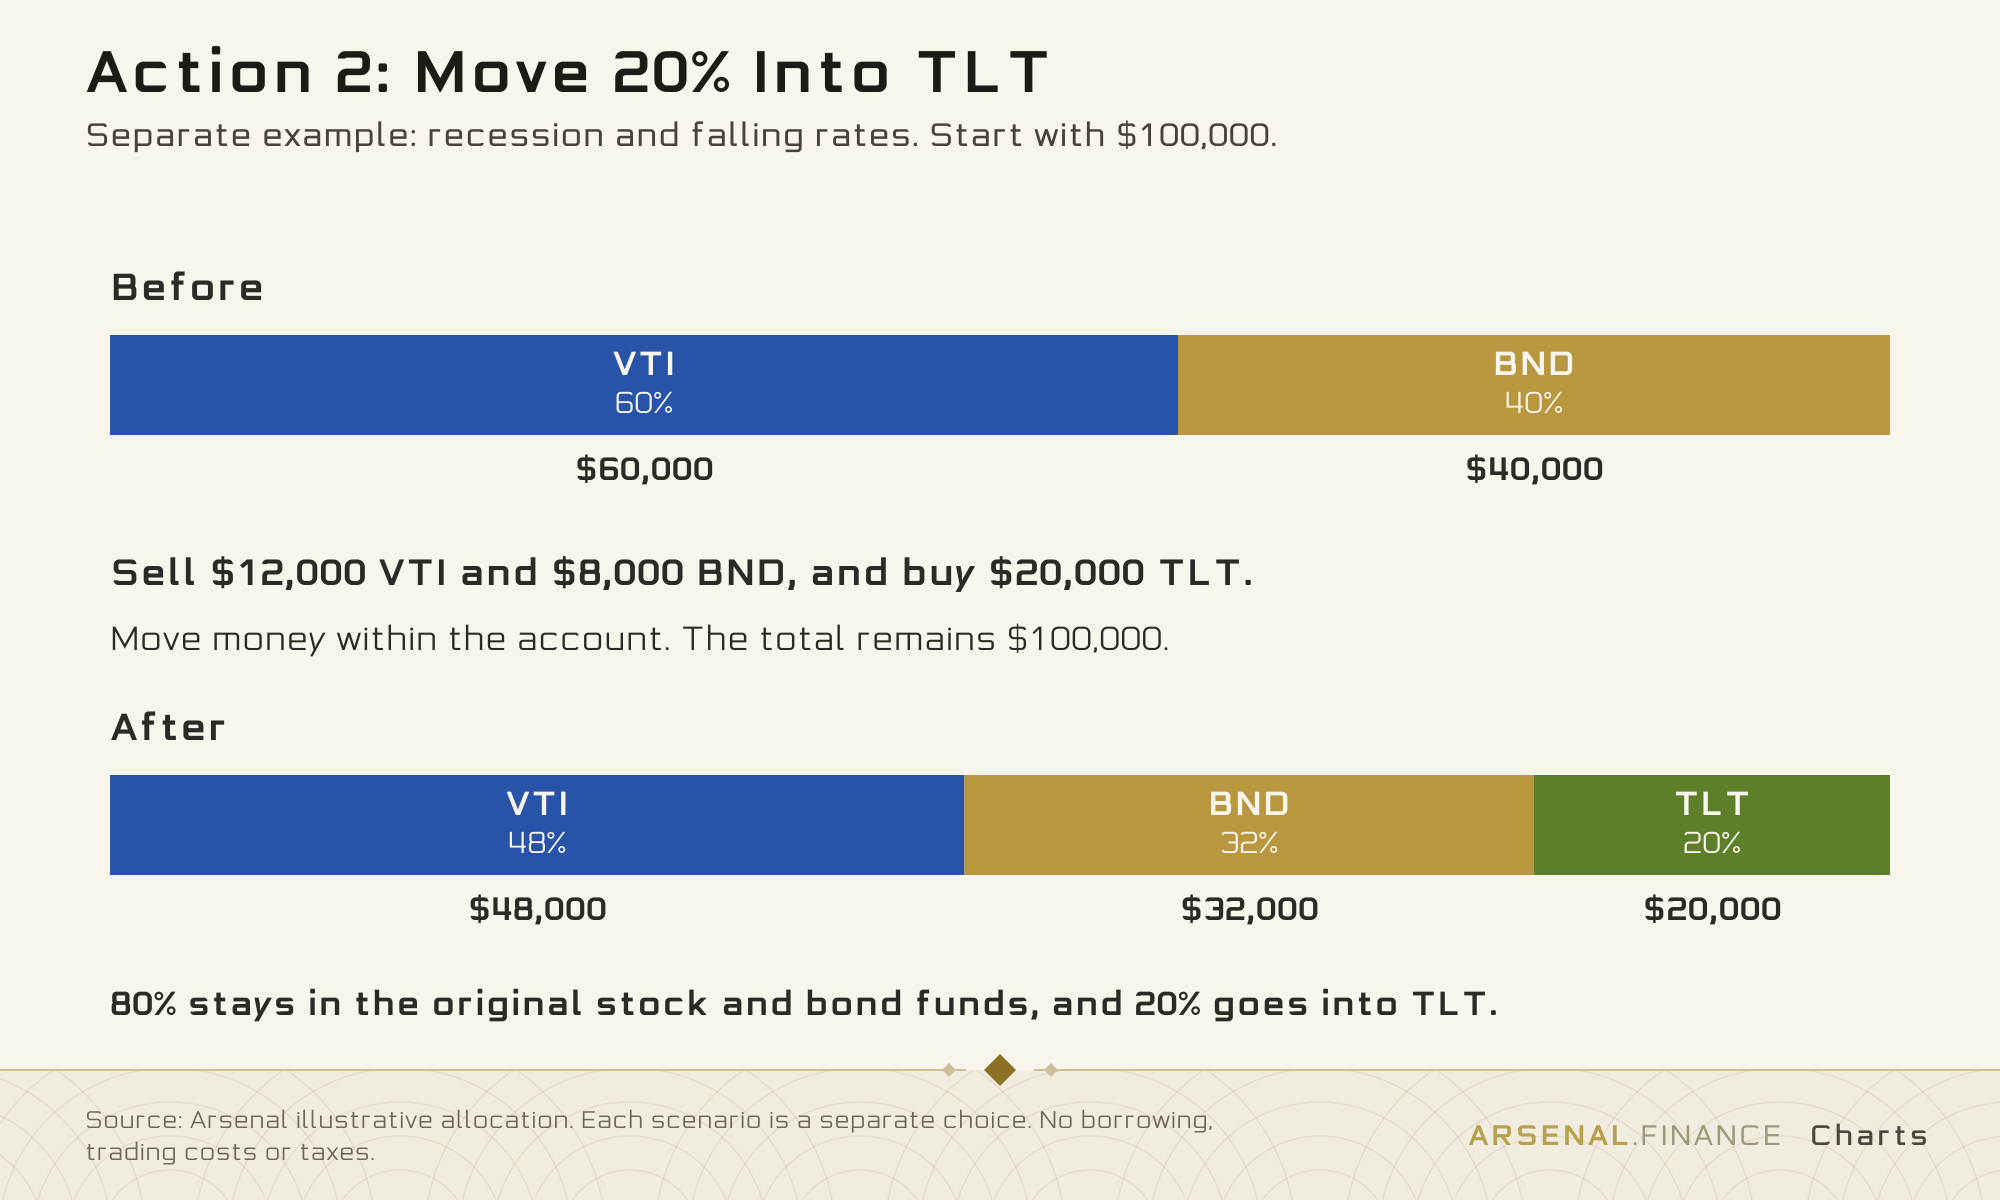
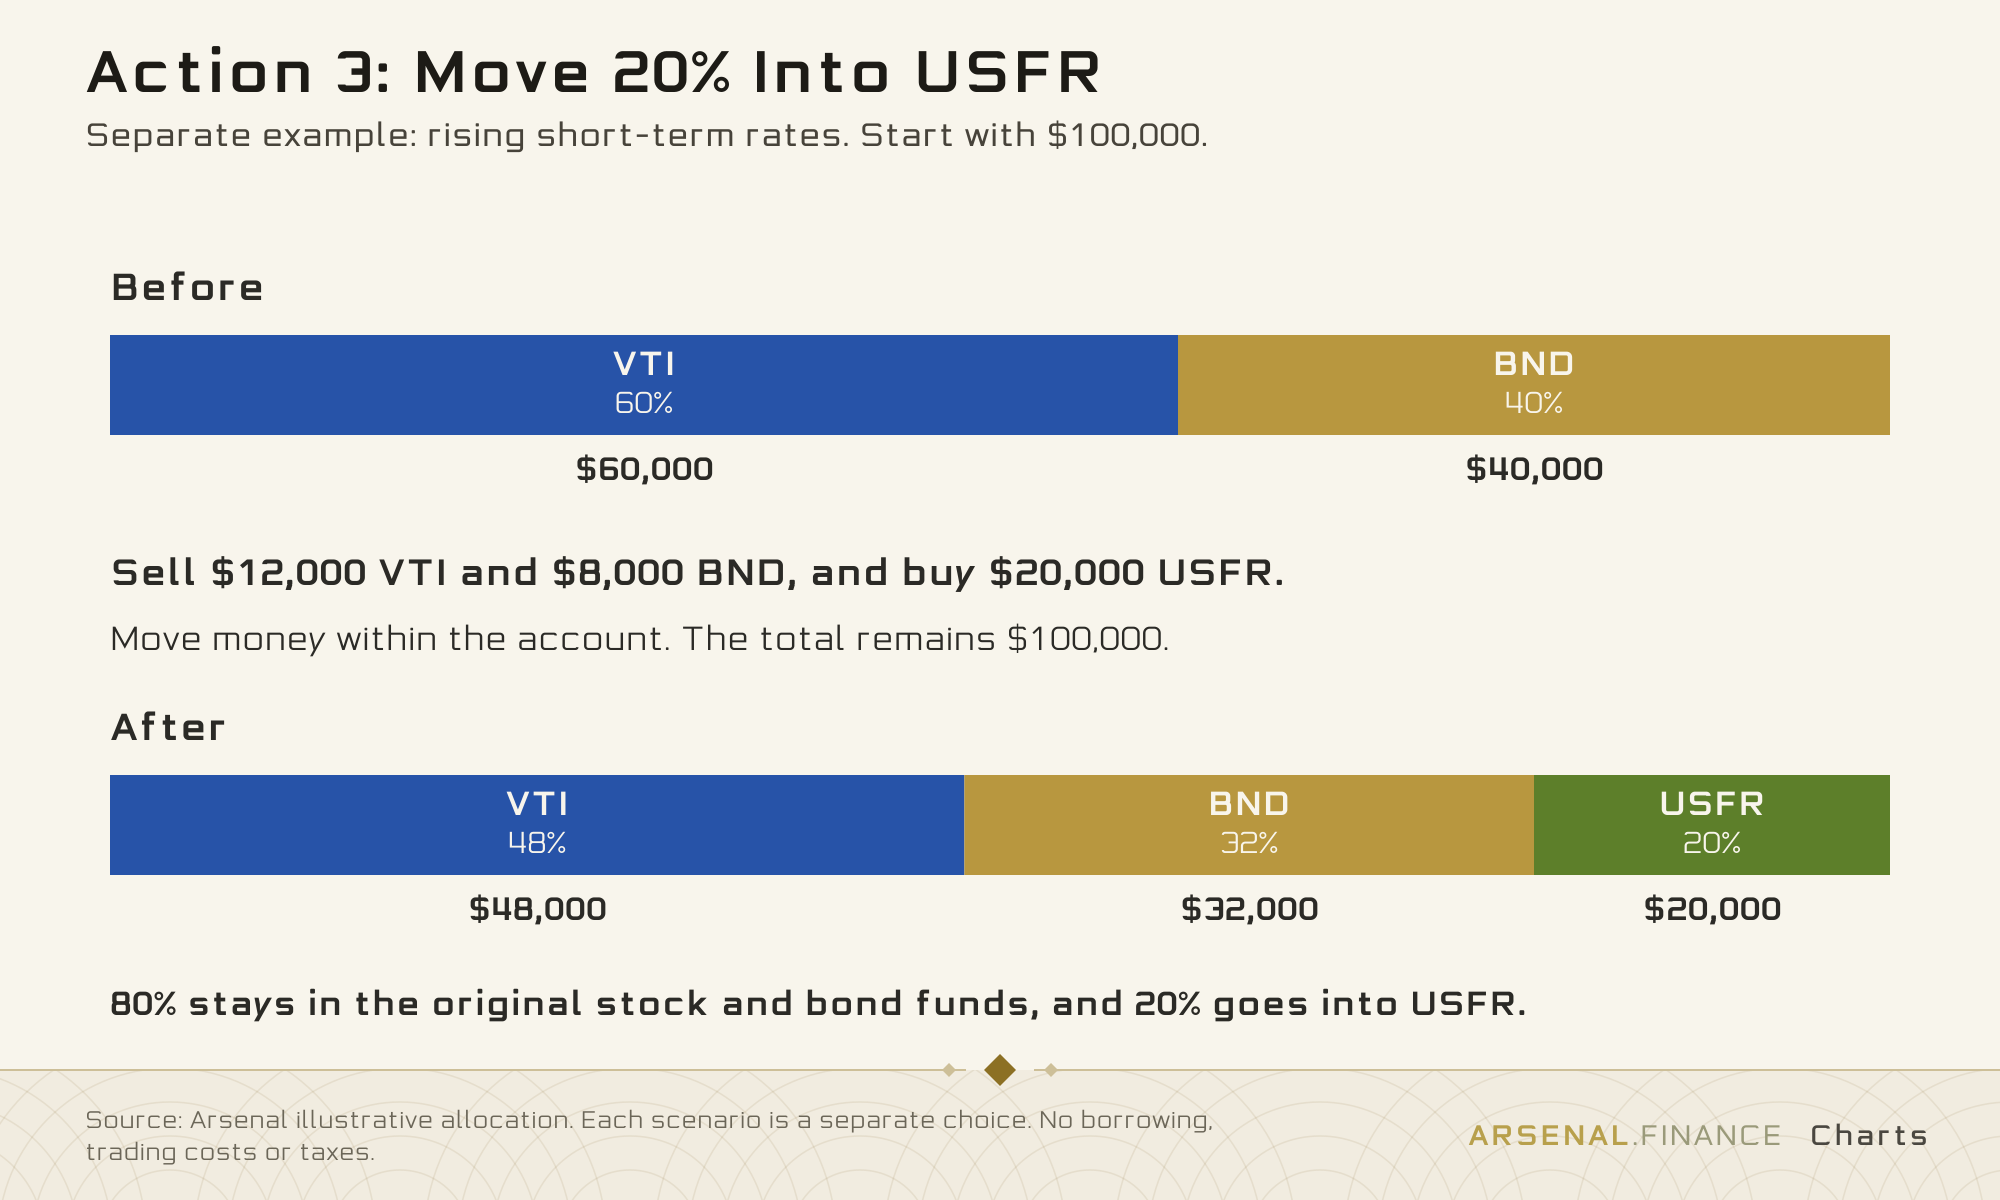
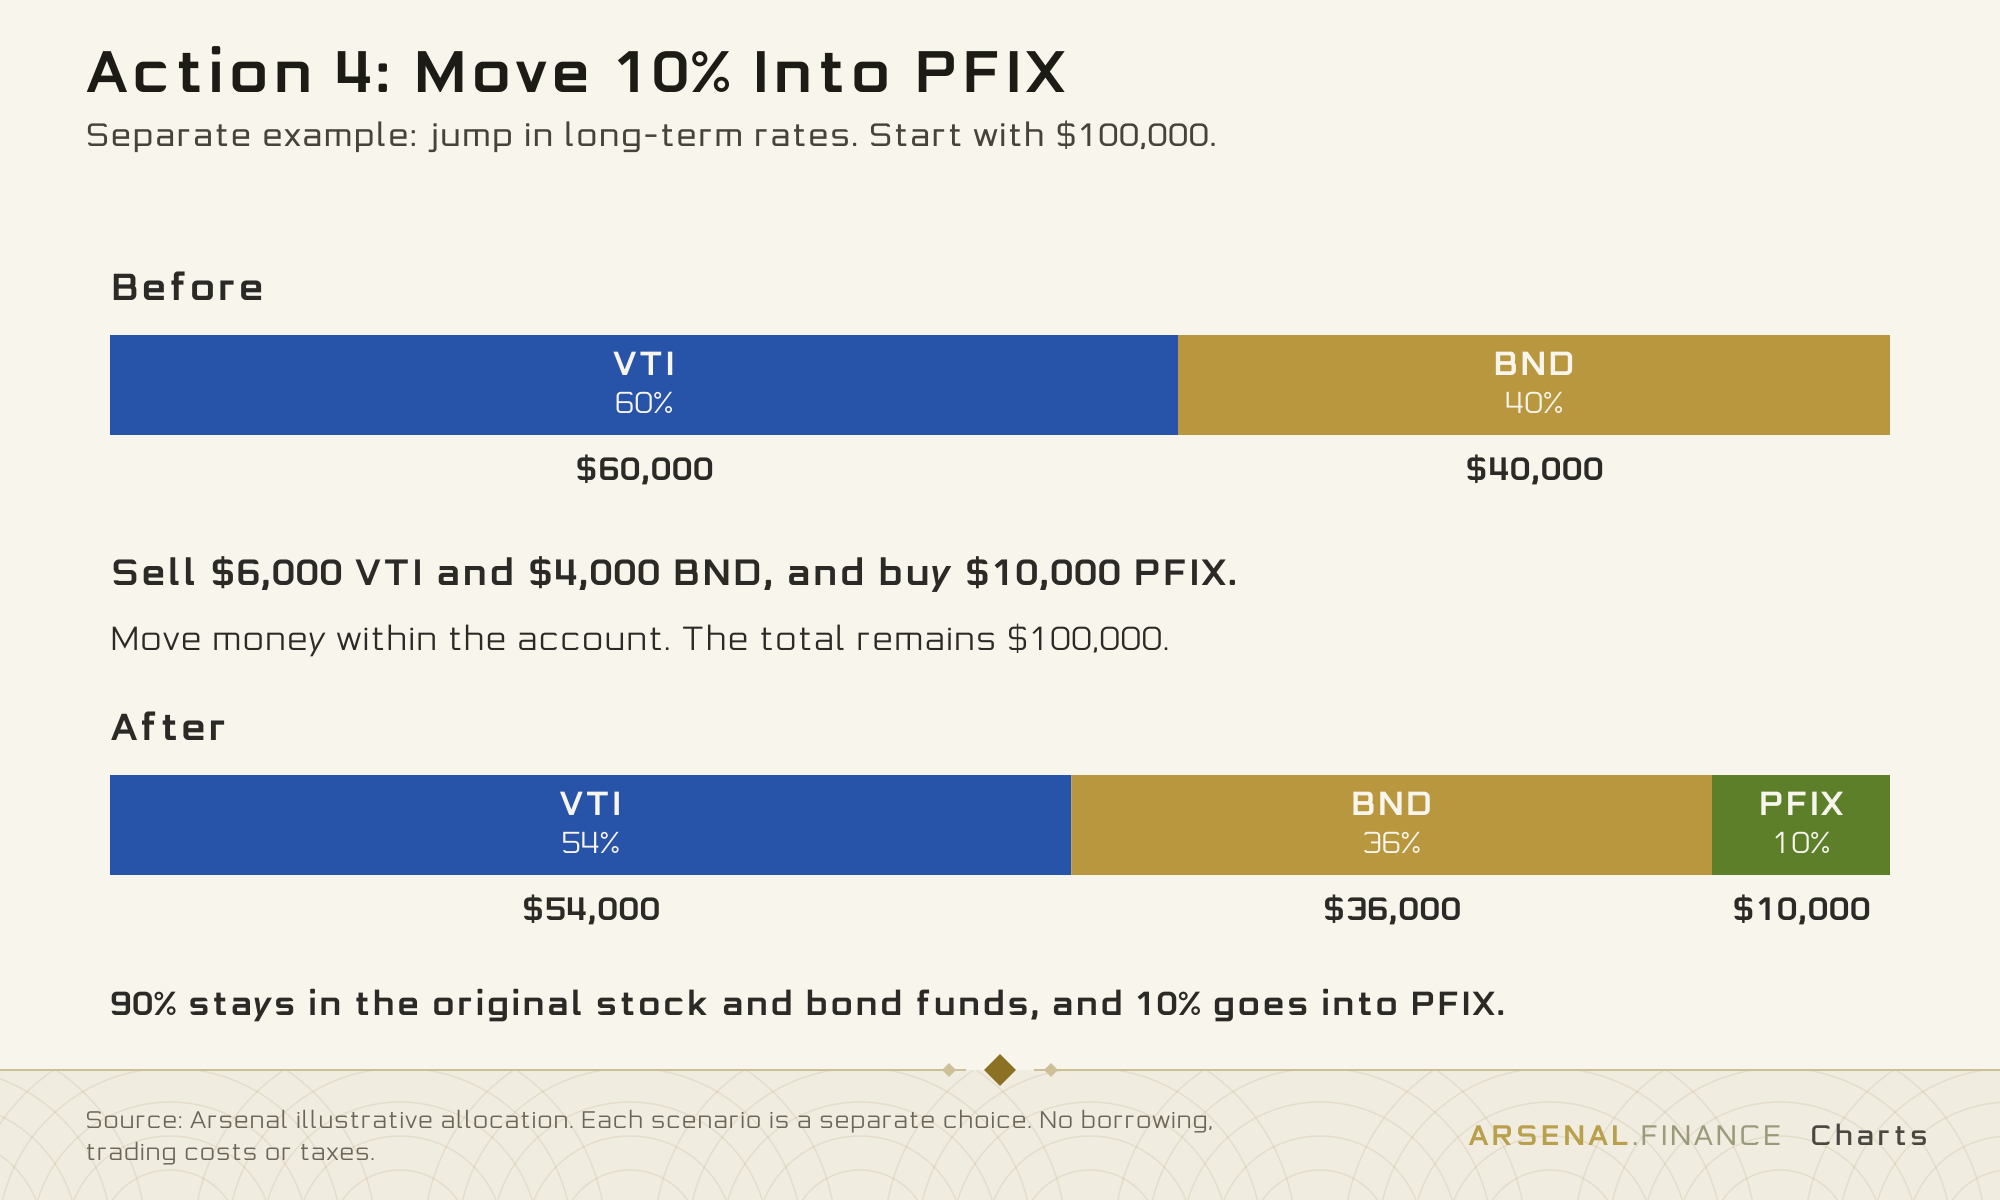
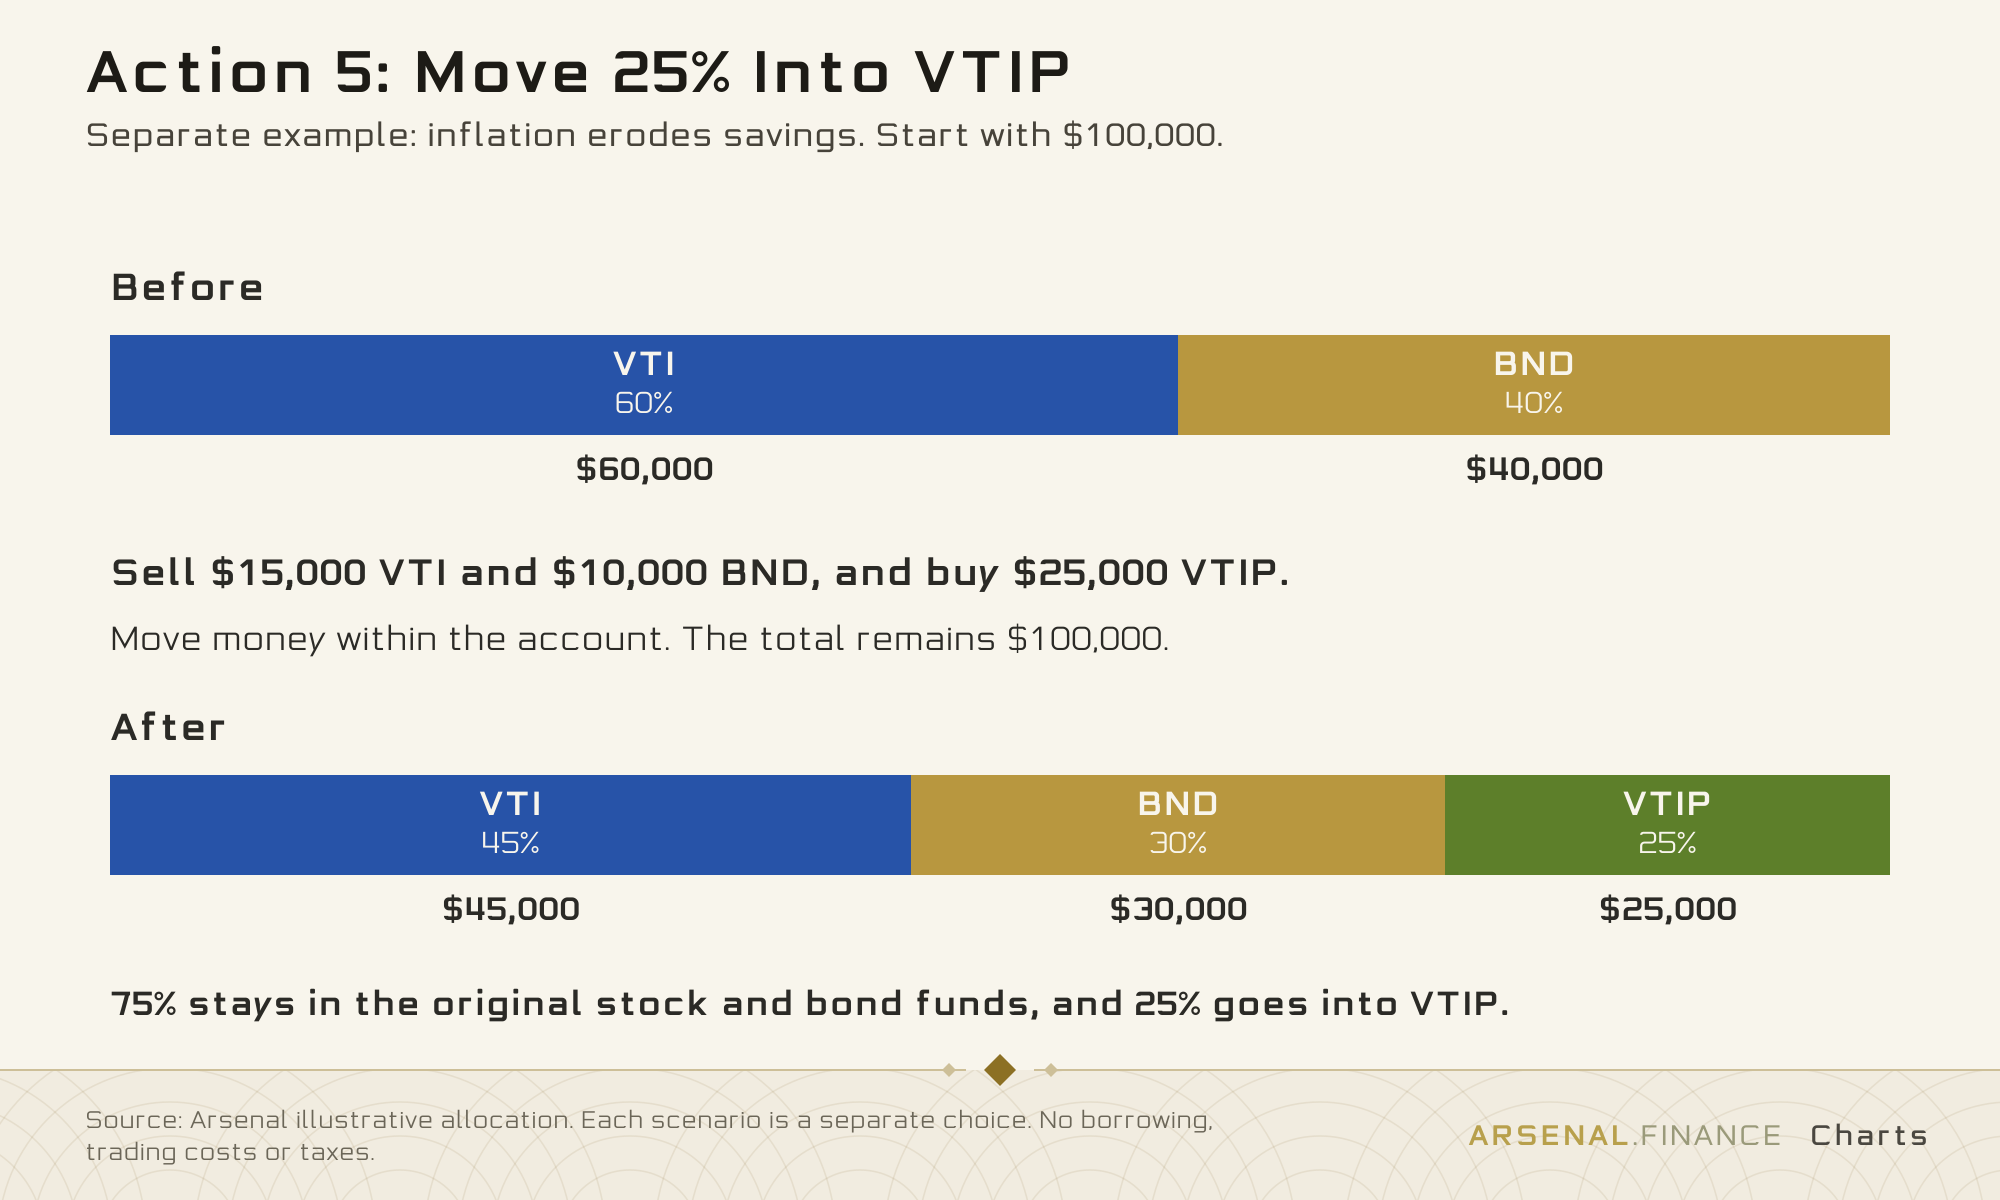
Start with $100,000: $60,000 in VTI, a broad U.S. stock fund, and $40,000 in BND, a broad U.S. bond fund. Each scenario sells a small part of both to fund one hedge, so most of the money stays invested. These are separate examples, not positions to add together, and they assume no borrowing and an emergency fund outside the account.
The table separates the risk from how each fund works. Some funds aim to gain when markets fall, and others simply leave less money exposed to the loss.
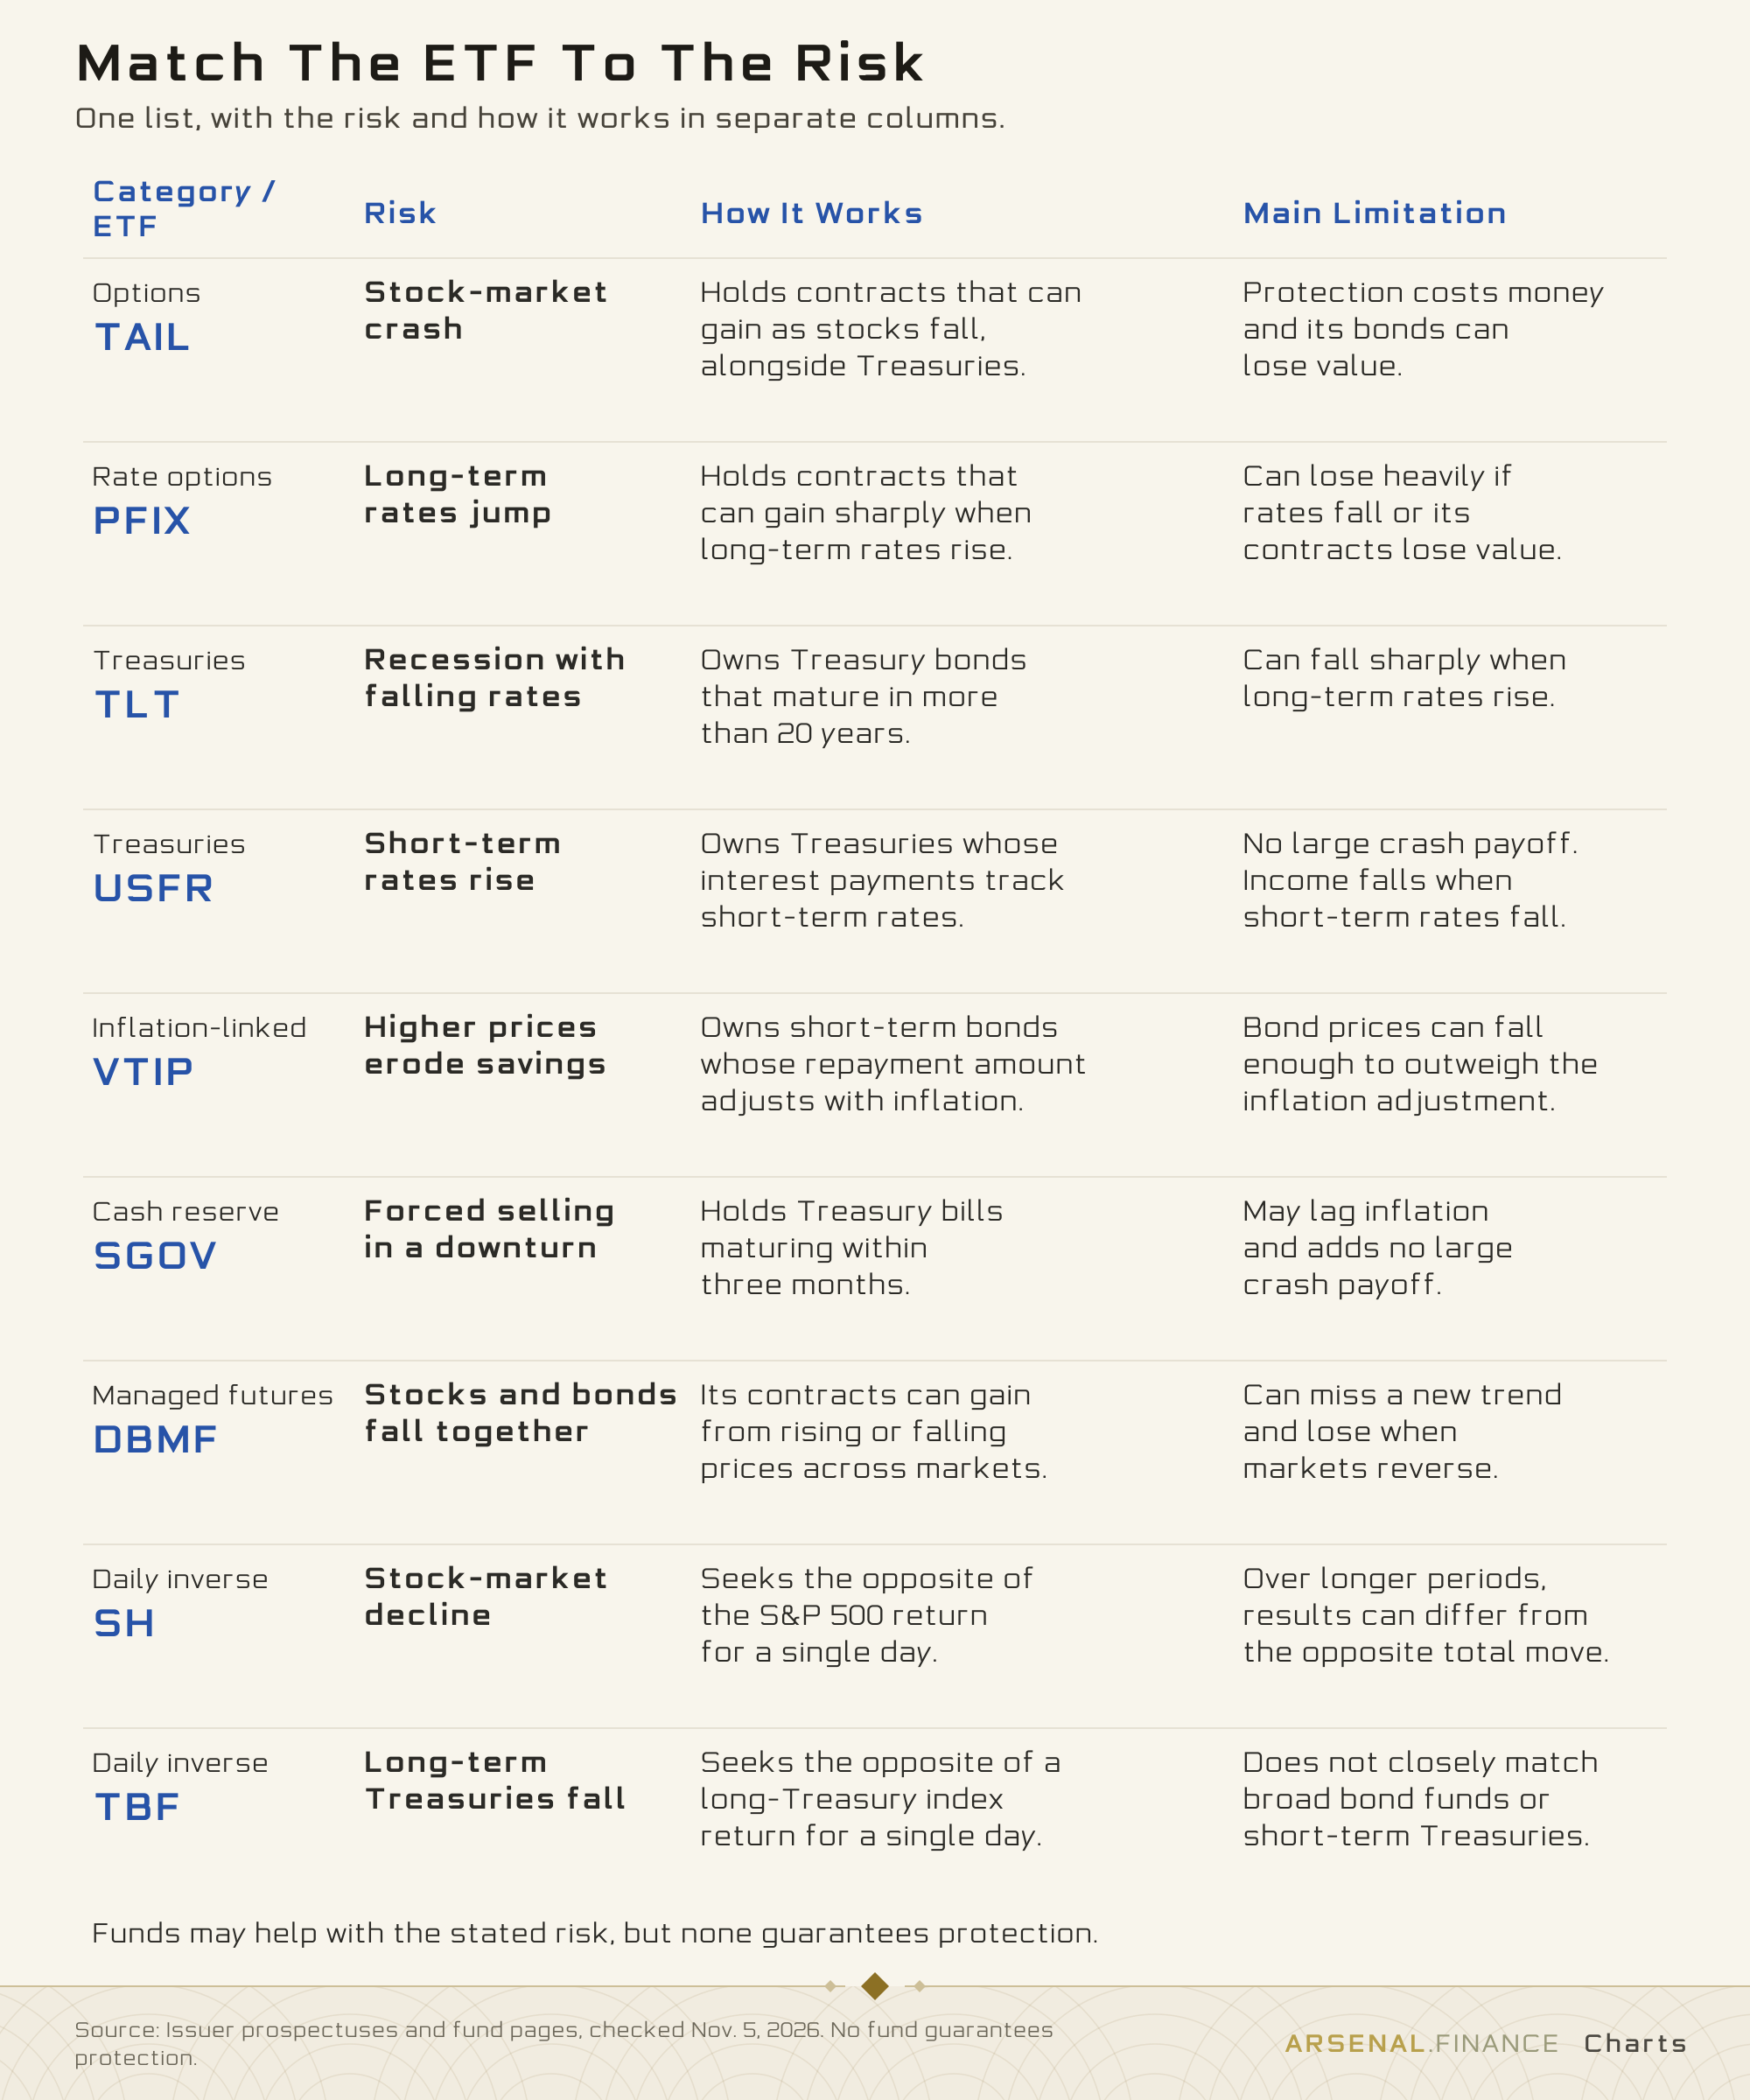
For each scenario, the action chart shows where the money goes and the result chart compares the whole account with the original 60/40. The one-year returns in these scenarios are invented examples, including income and fund expenses, so they show the arithmetic rather than predict the funds. The actual 2022 results appear separately at the end.
Scenario 1: A sharp stock-market crash
TAIL holds contracts that can gain when stocks fall, alongside Treasury bonds. In the first example, that reduces the account loss from 18% to 9.4%, but the recovery case shows how protection can hold back gains.
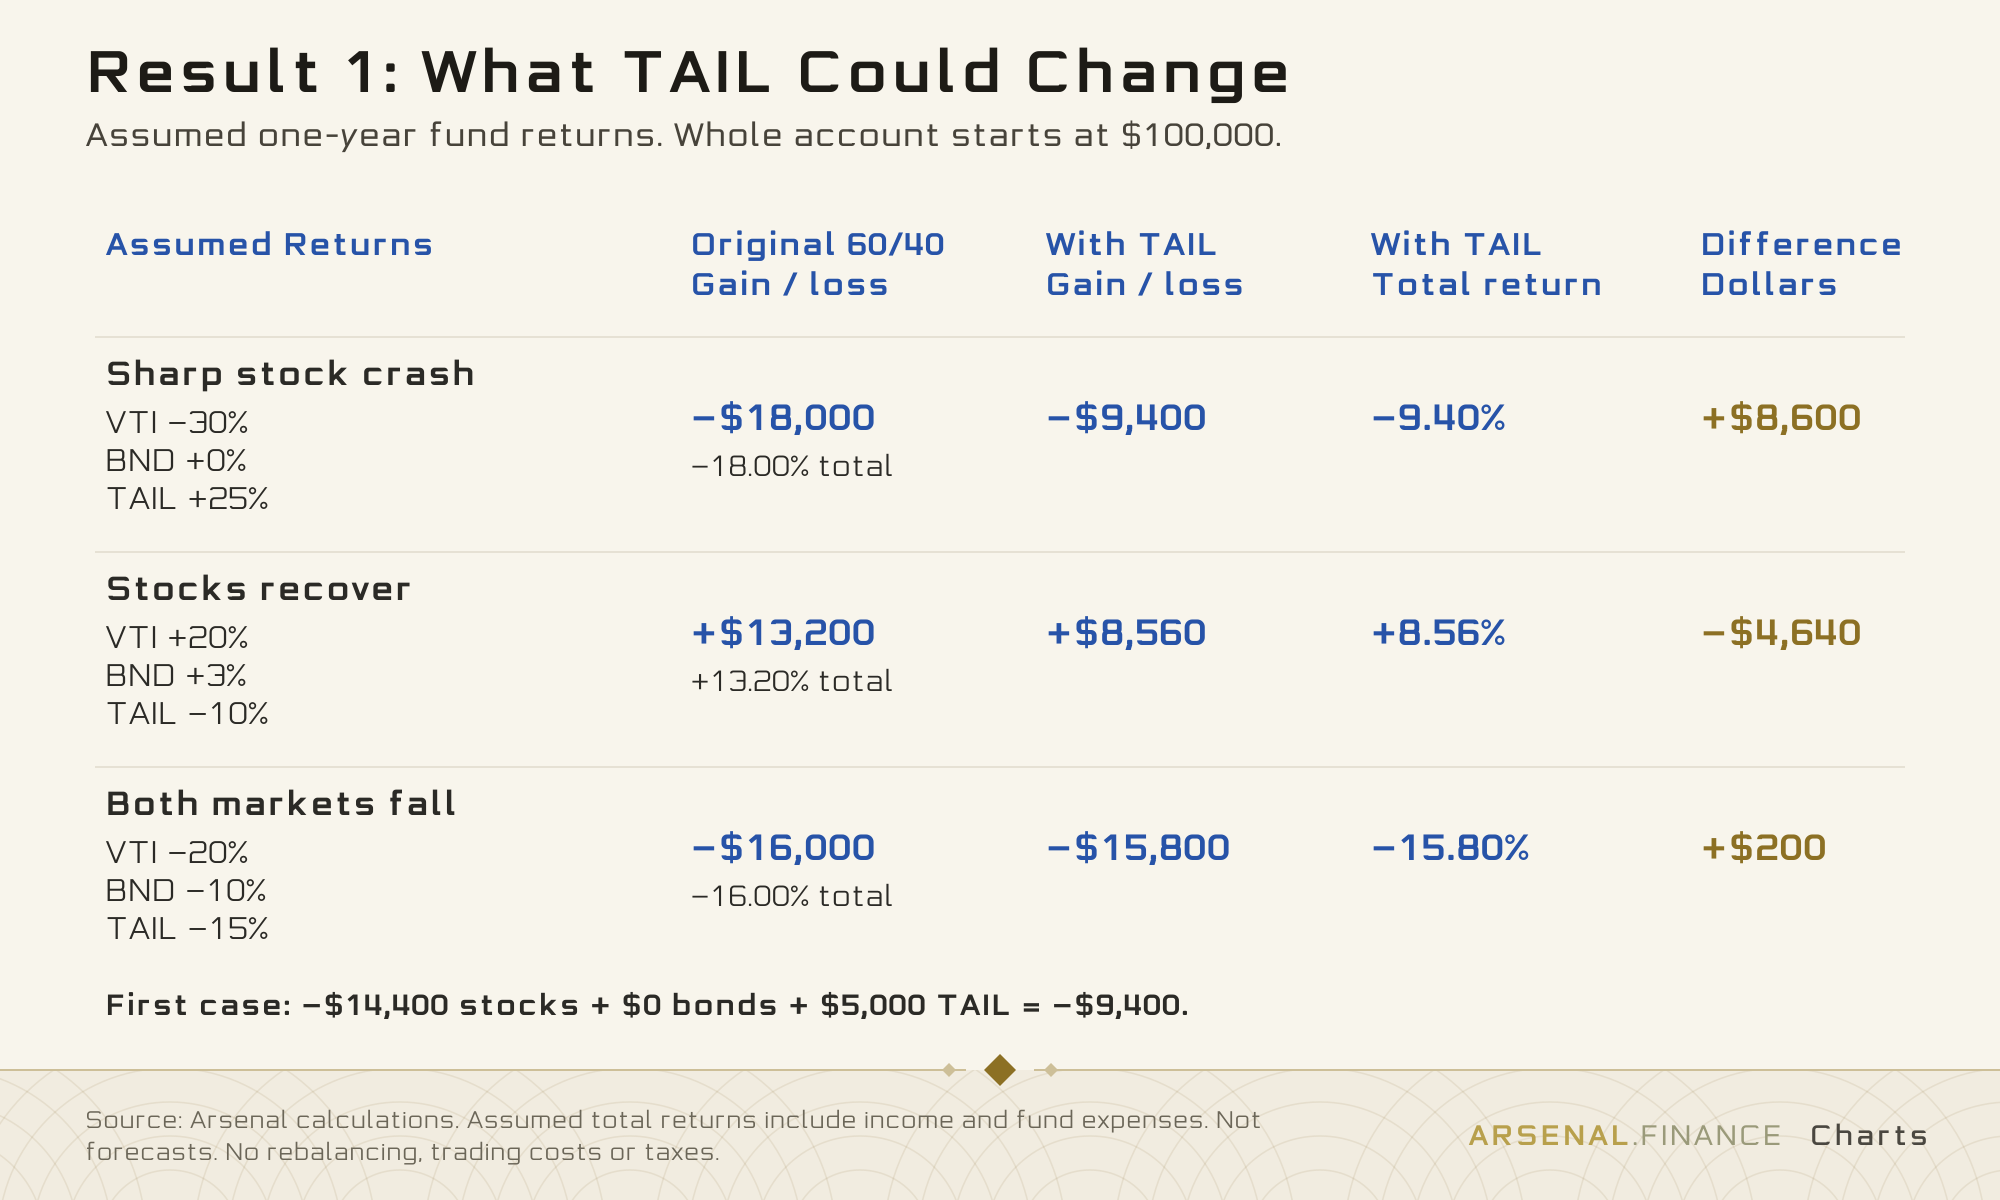
Its Treasury holdings can also lose value, so TAIL may offer little help when stocks and bonds fall together.
Scenario 2: A recession with falling long-term rates
TLT owns long-term Treasury bonds, and falling rates can raise their prices while stocks struggle. The first example cuts the account loss from 10% to 4.8%.
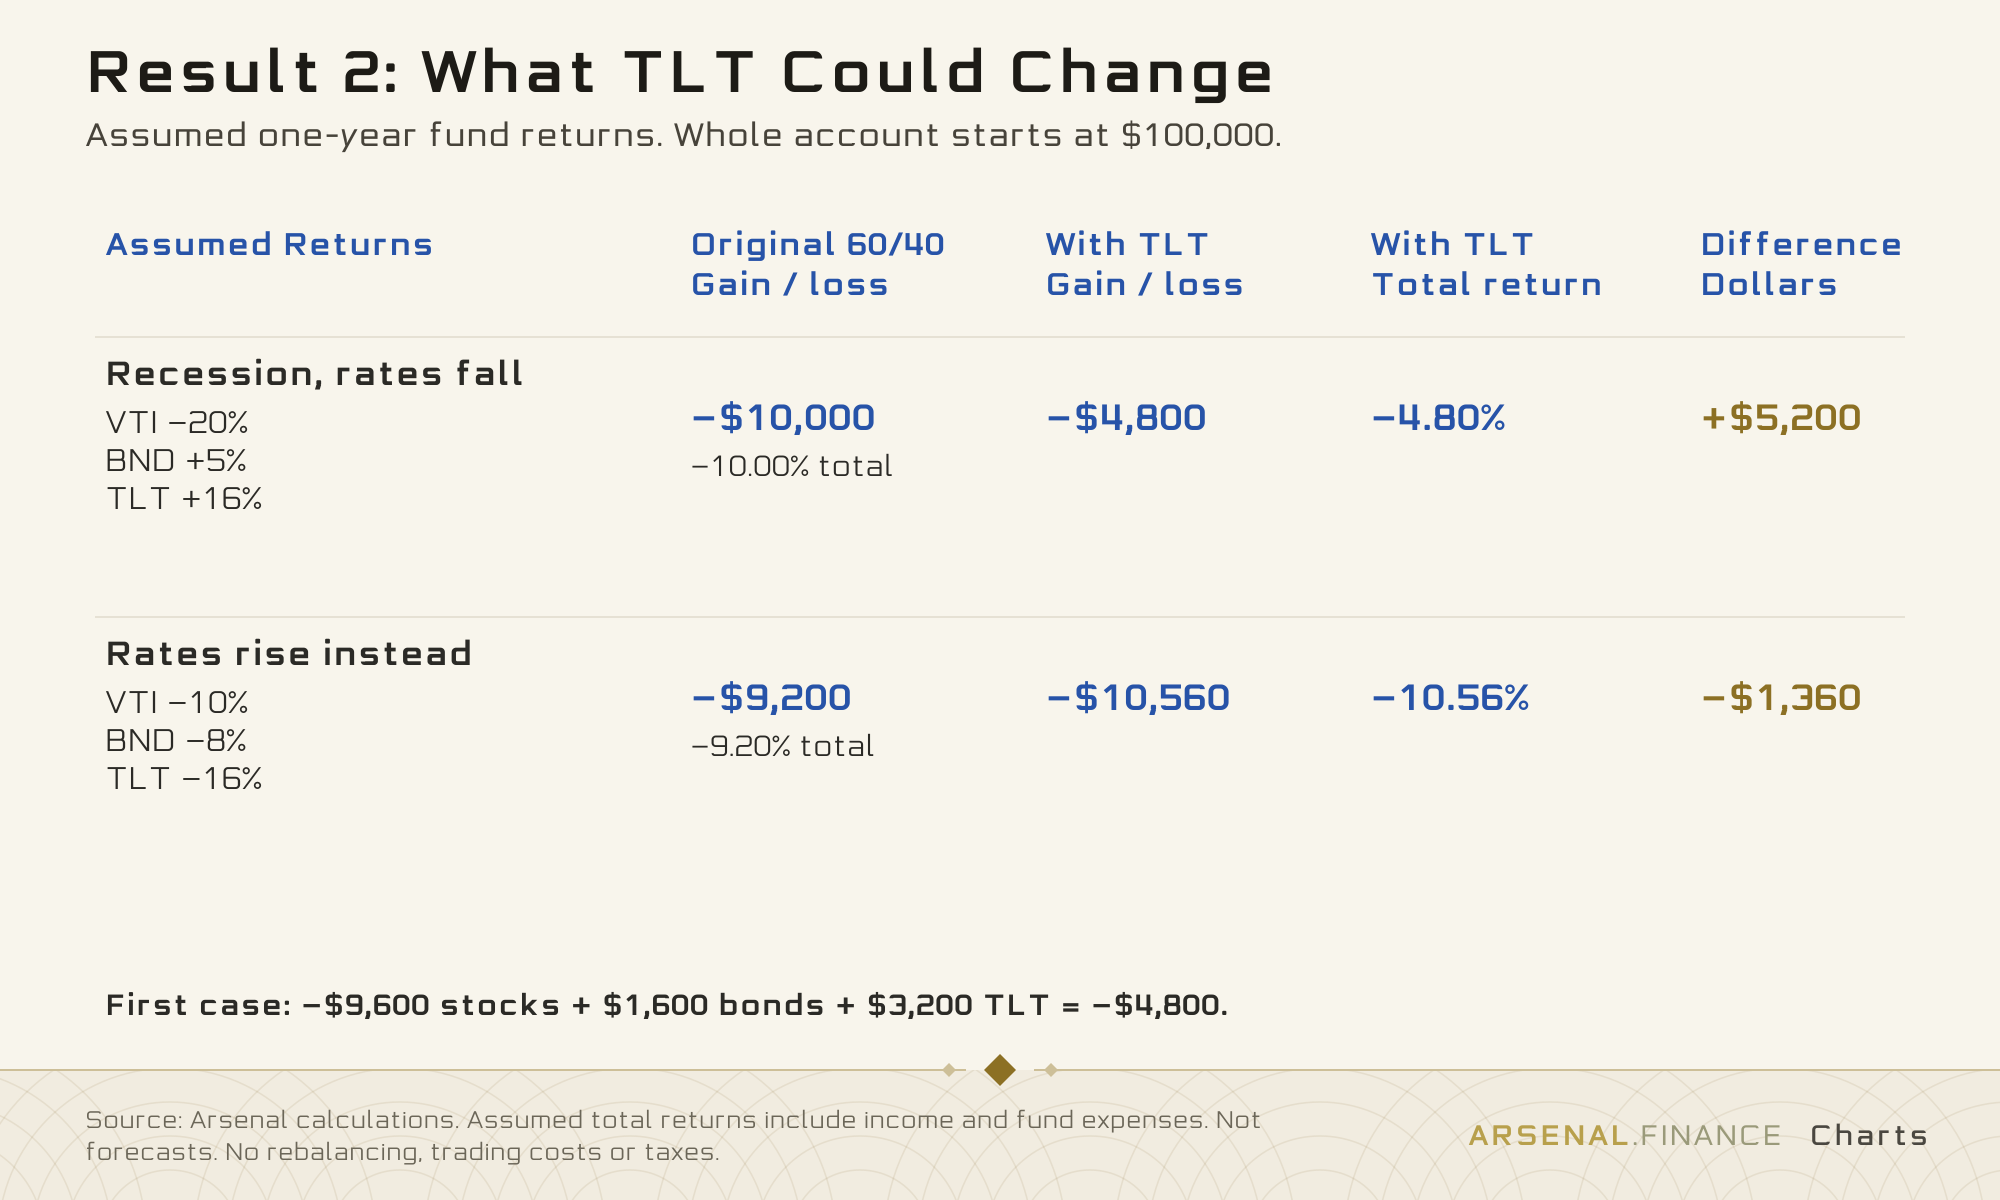
The reverse can happen if rates rise, so TLT can deepen the loss when the recession comes with inflation.
Scenario 3: Rising short-term rates hurt fixed-rate bonds
USFR owns Treasuries whose interest payments adjust with short-term rates, so rising rates can increase its income without the same price swings as fixed-rate bonds.
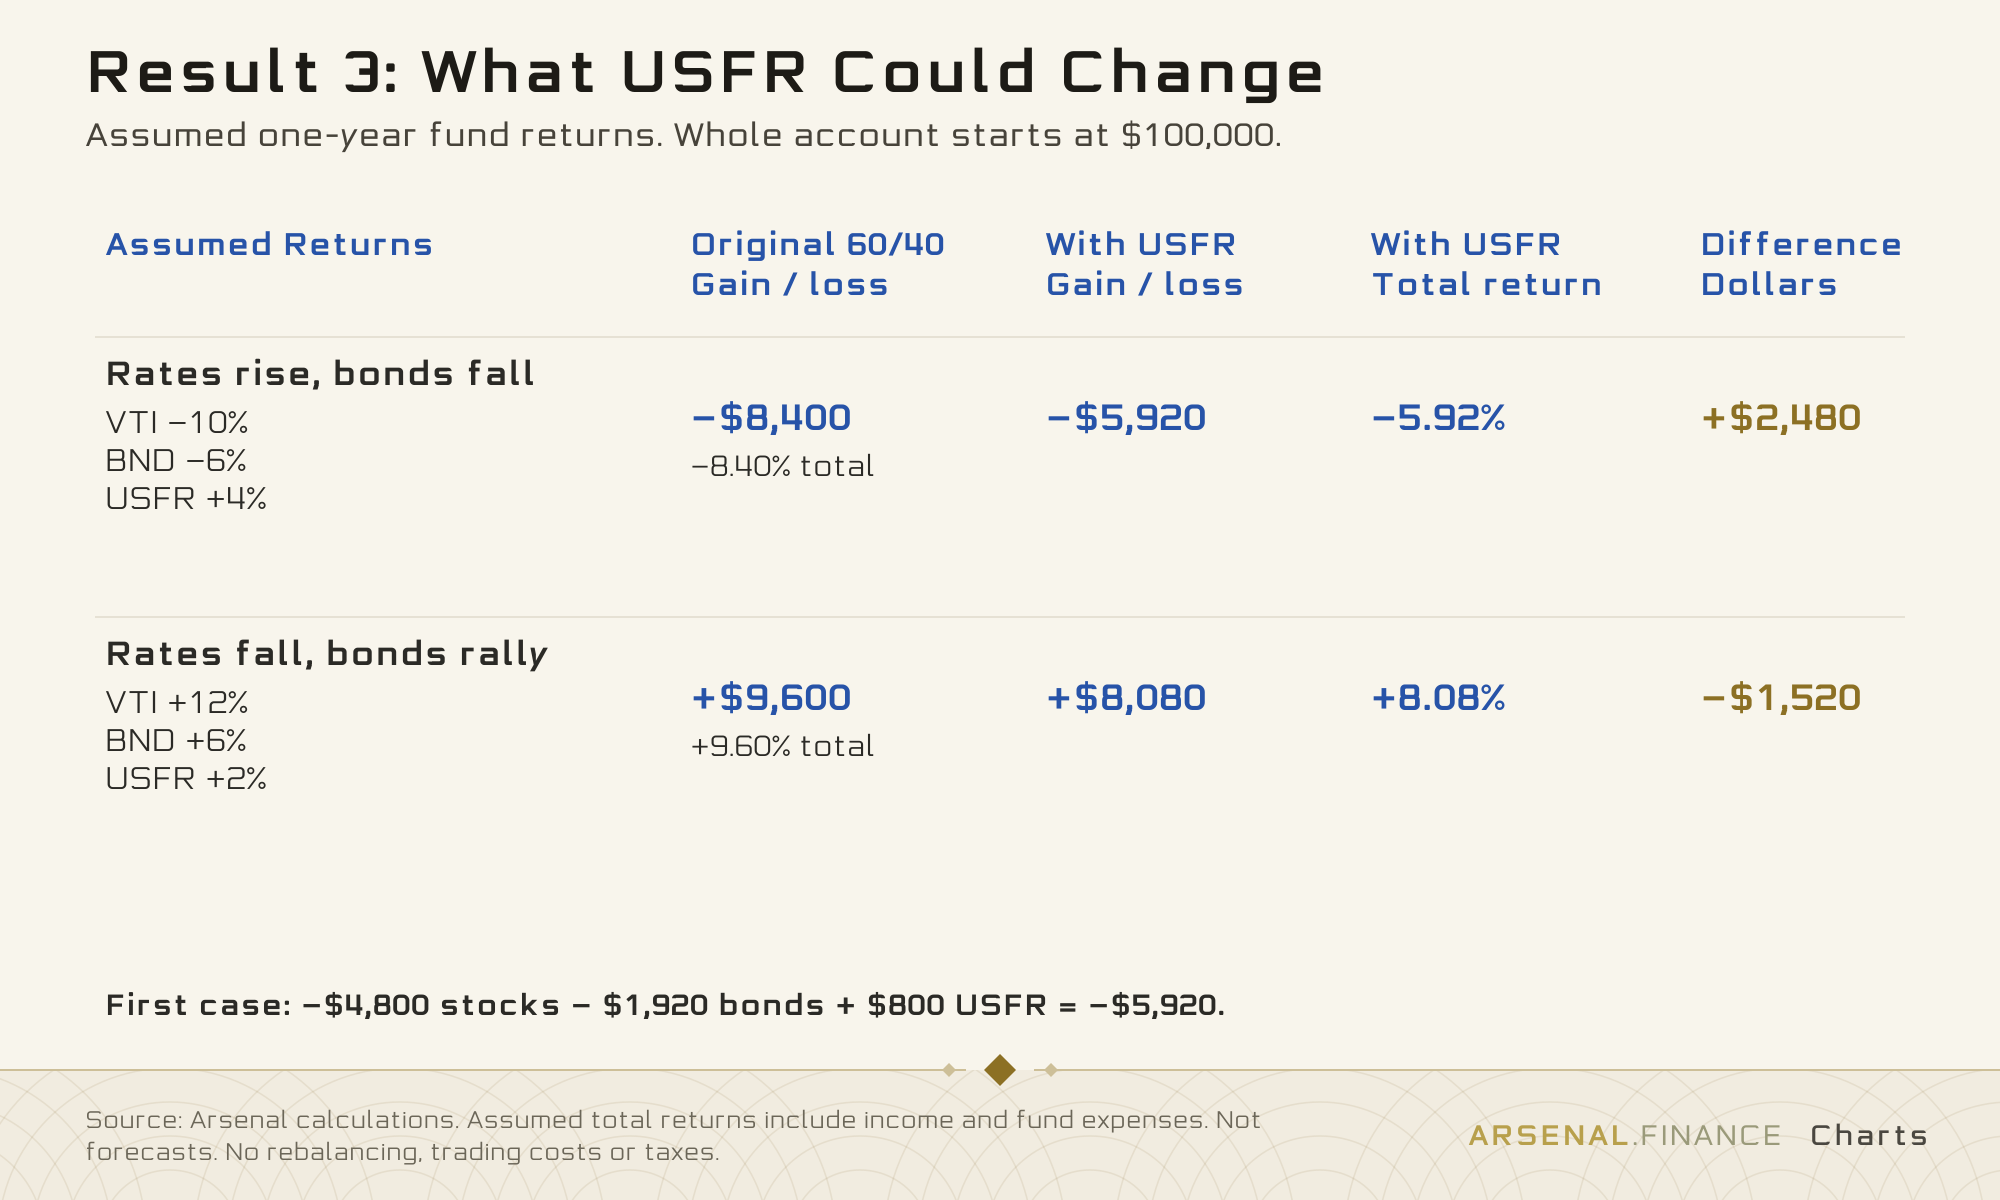
This keeps part of the account steadier, but it does not produce a large crash payoff. If bond prices rebound, the original account can do better.
Scenario 4: A sharp jump in long-term rates
PFIX uses contracts designed to gain when long-term rates rise sharply. Even a 10% position can change the result, and the first example reduces the loss from 13.8% to 6.42%.
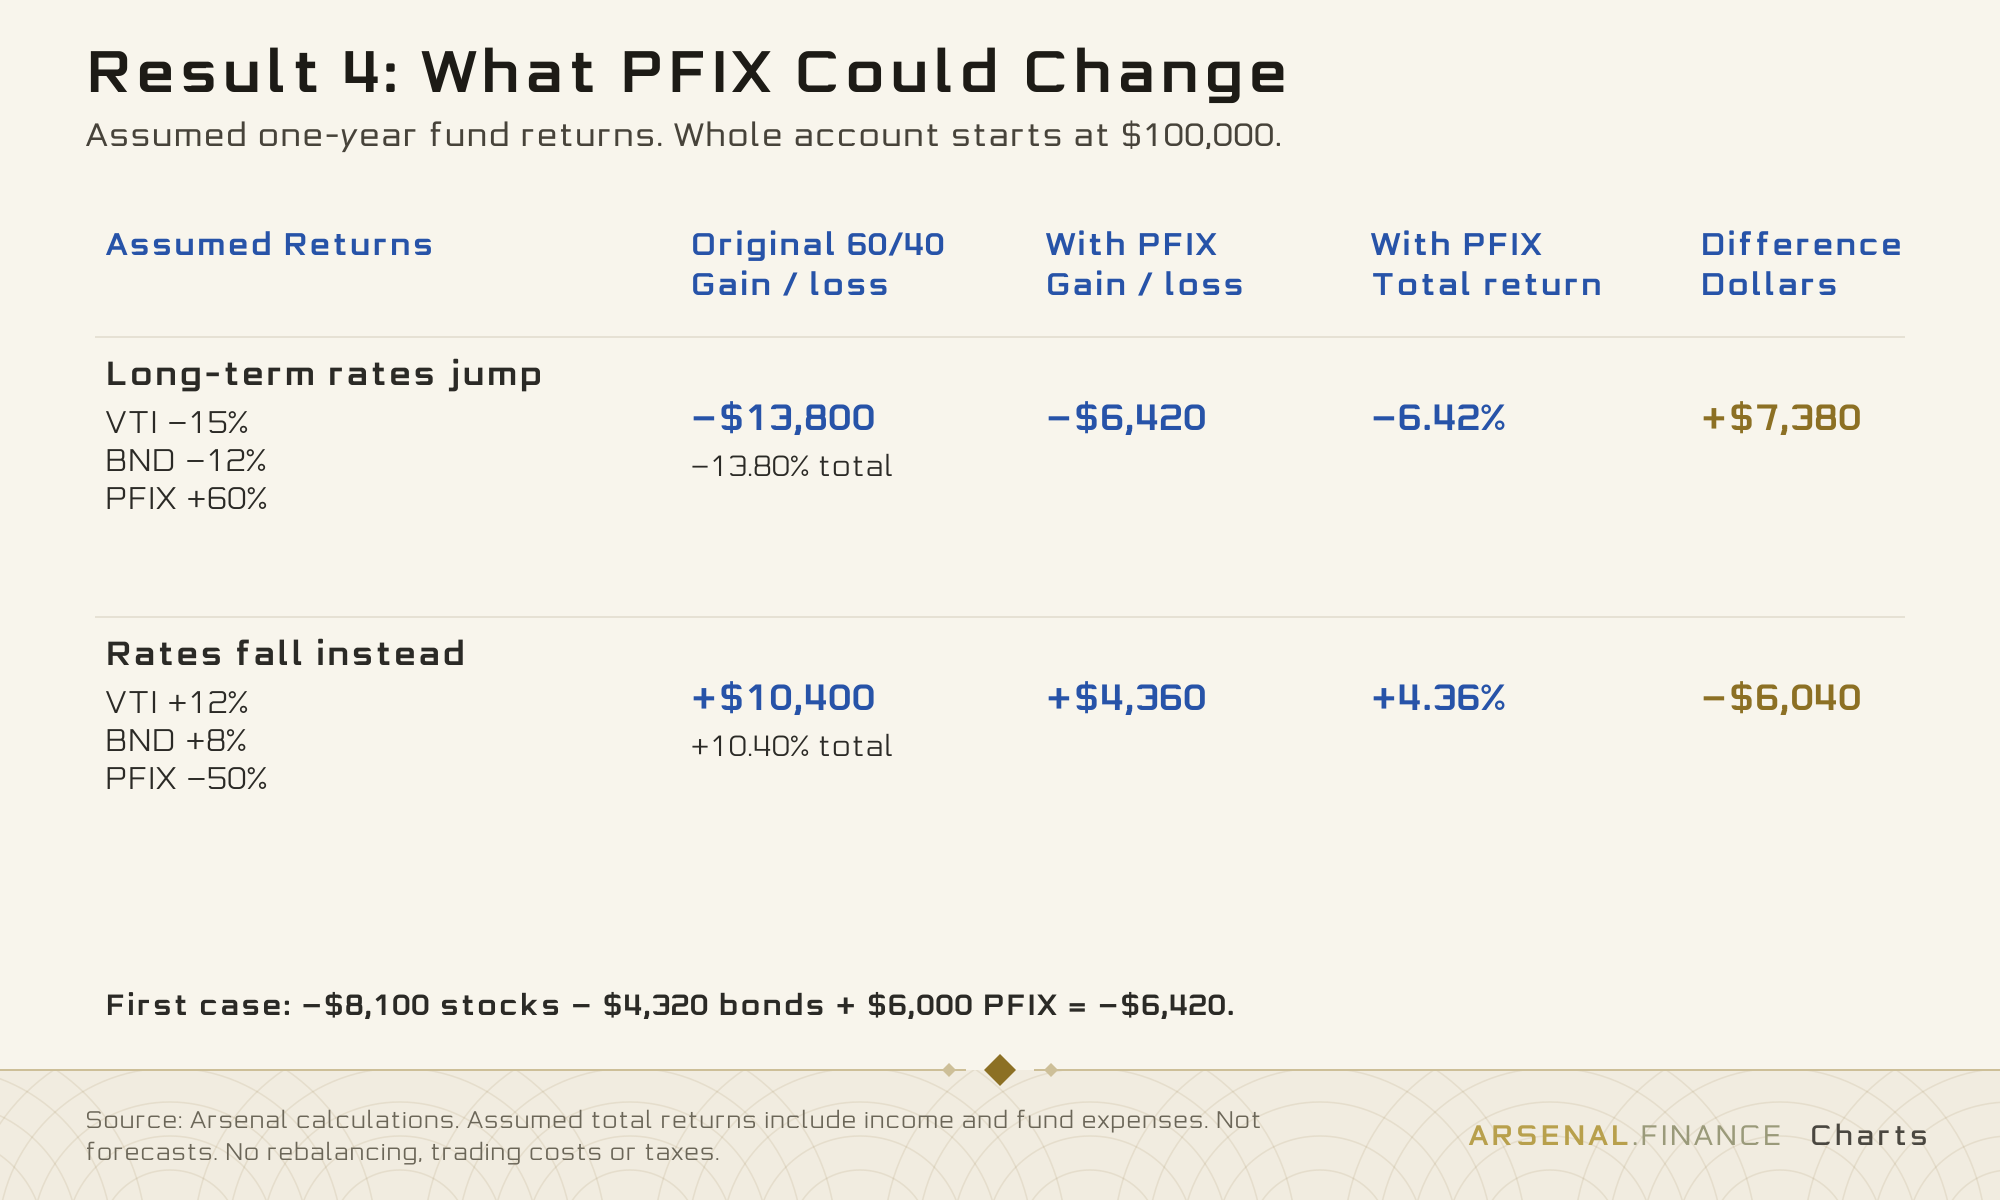
The same position can be expensive when the hedge is wrong. A 50% PFIX loss costs the account $5,000 before counting the other funds.
Scenario 5: Inflation erodes the value of savings
VTIP owns short-term Treasury bonds whose repayment amount adjusts with U.S. inflation, so part of the account responds to rising consumer prices.
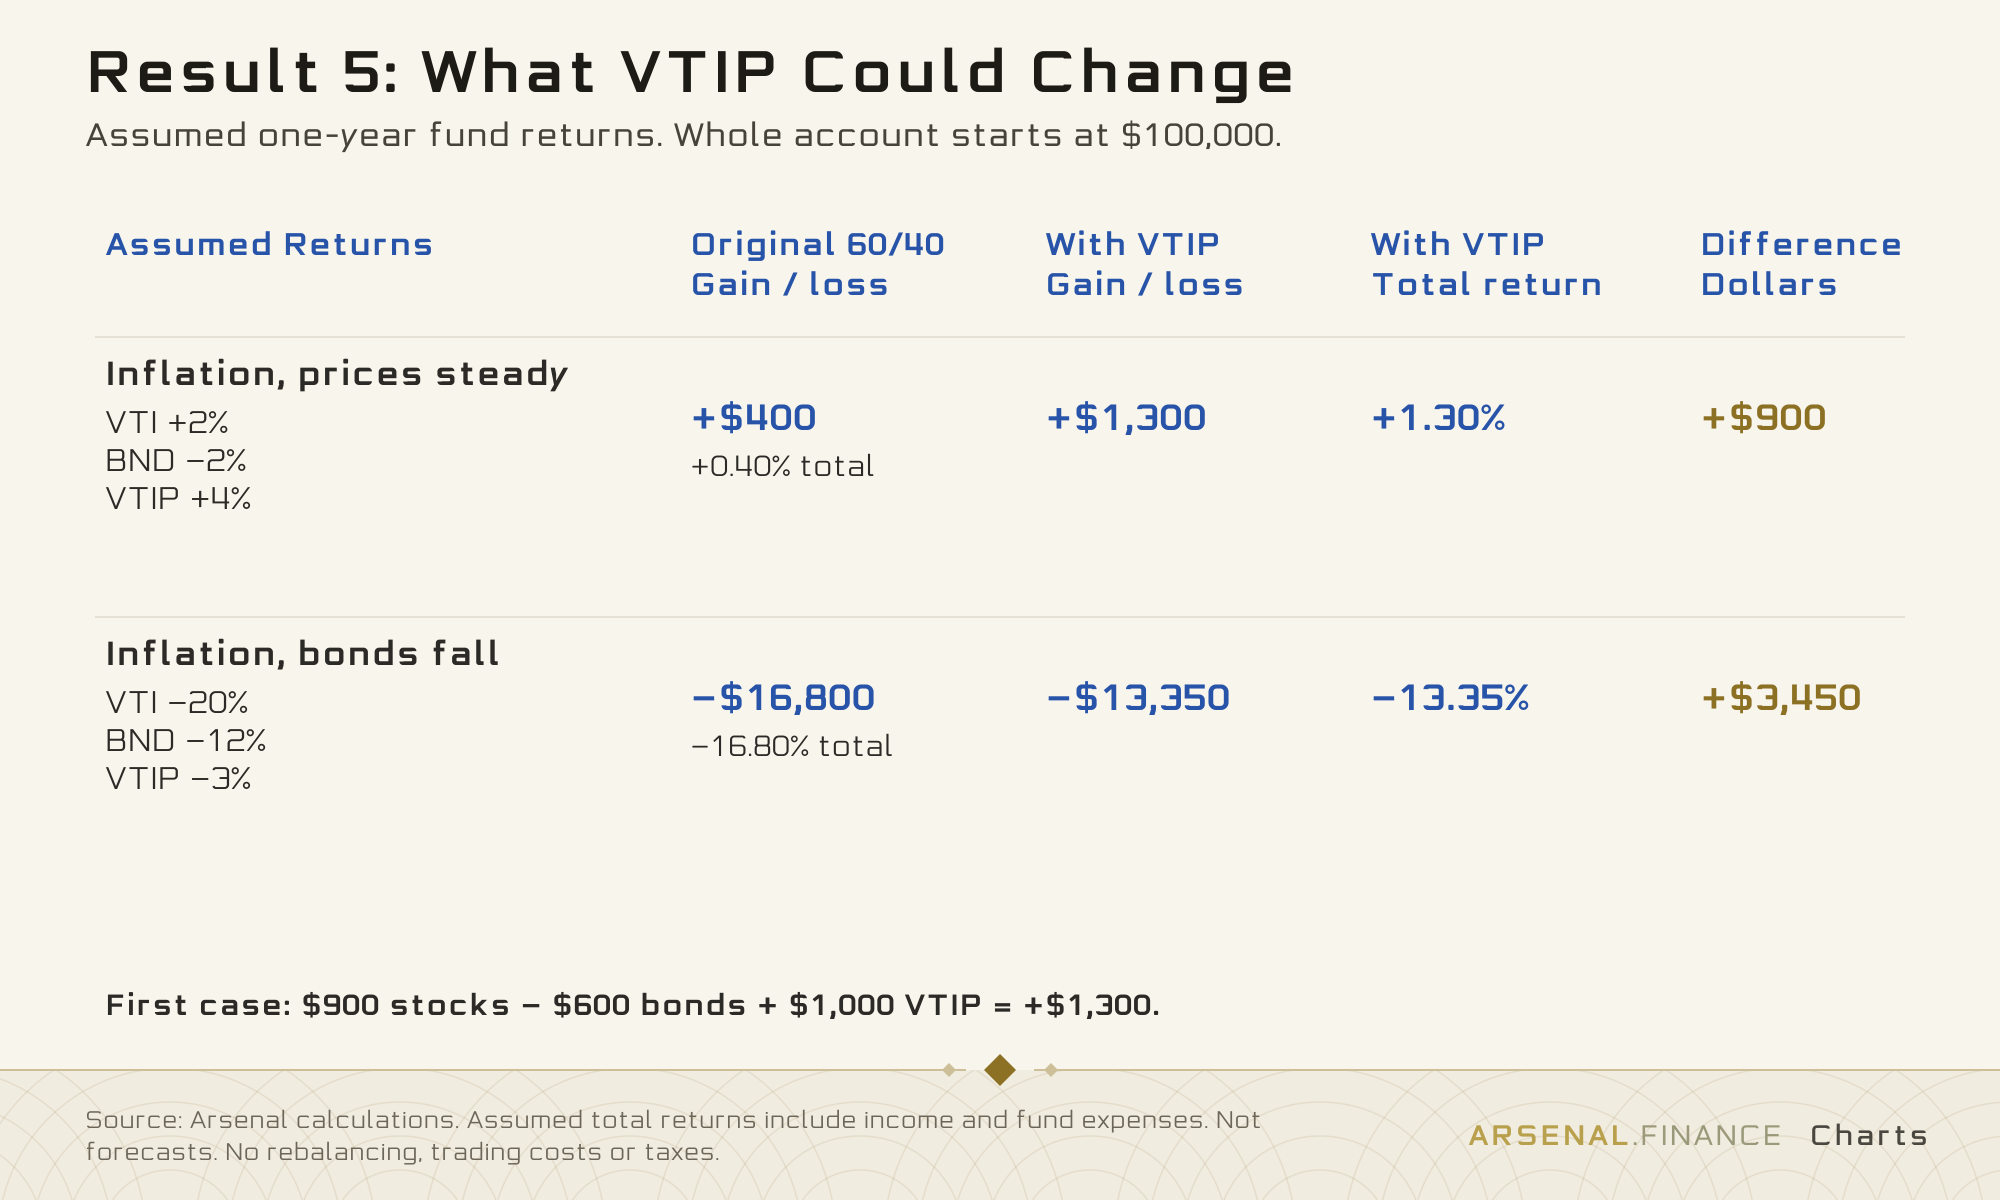
That adjustment does not guarantee a positive fund return. Bond prices can fall enough to outweigh it, as the second example shows.
Scenario 6: Stocks and bonds fall together
DBMF uses contracts that can gain from rising or falling prices across stocks, bonds, currencies and commodities, so it has another way to earn money when a 60/40 portfolio struggles.
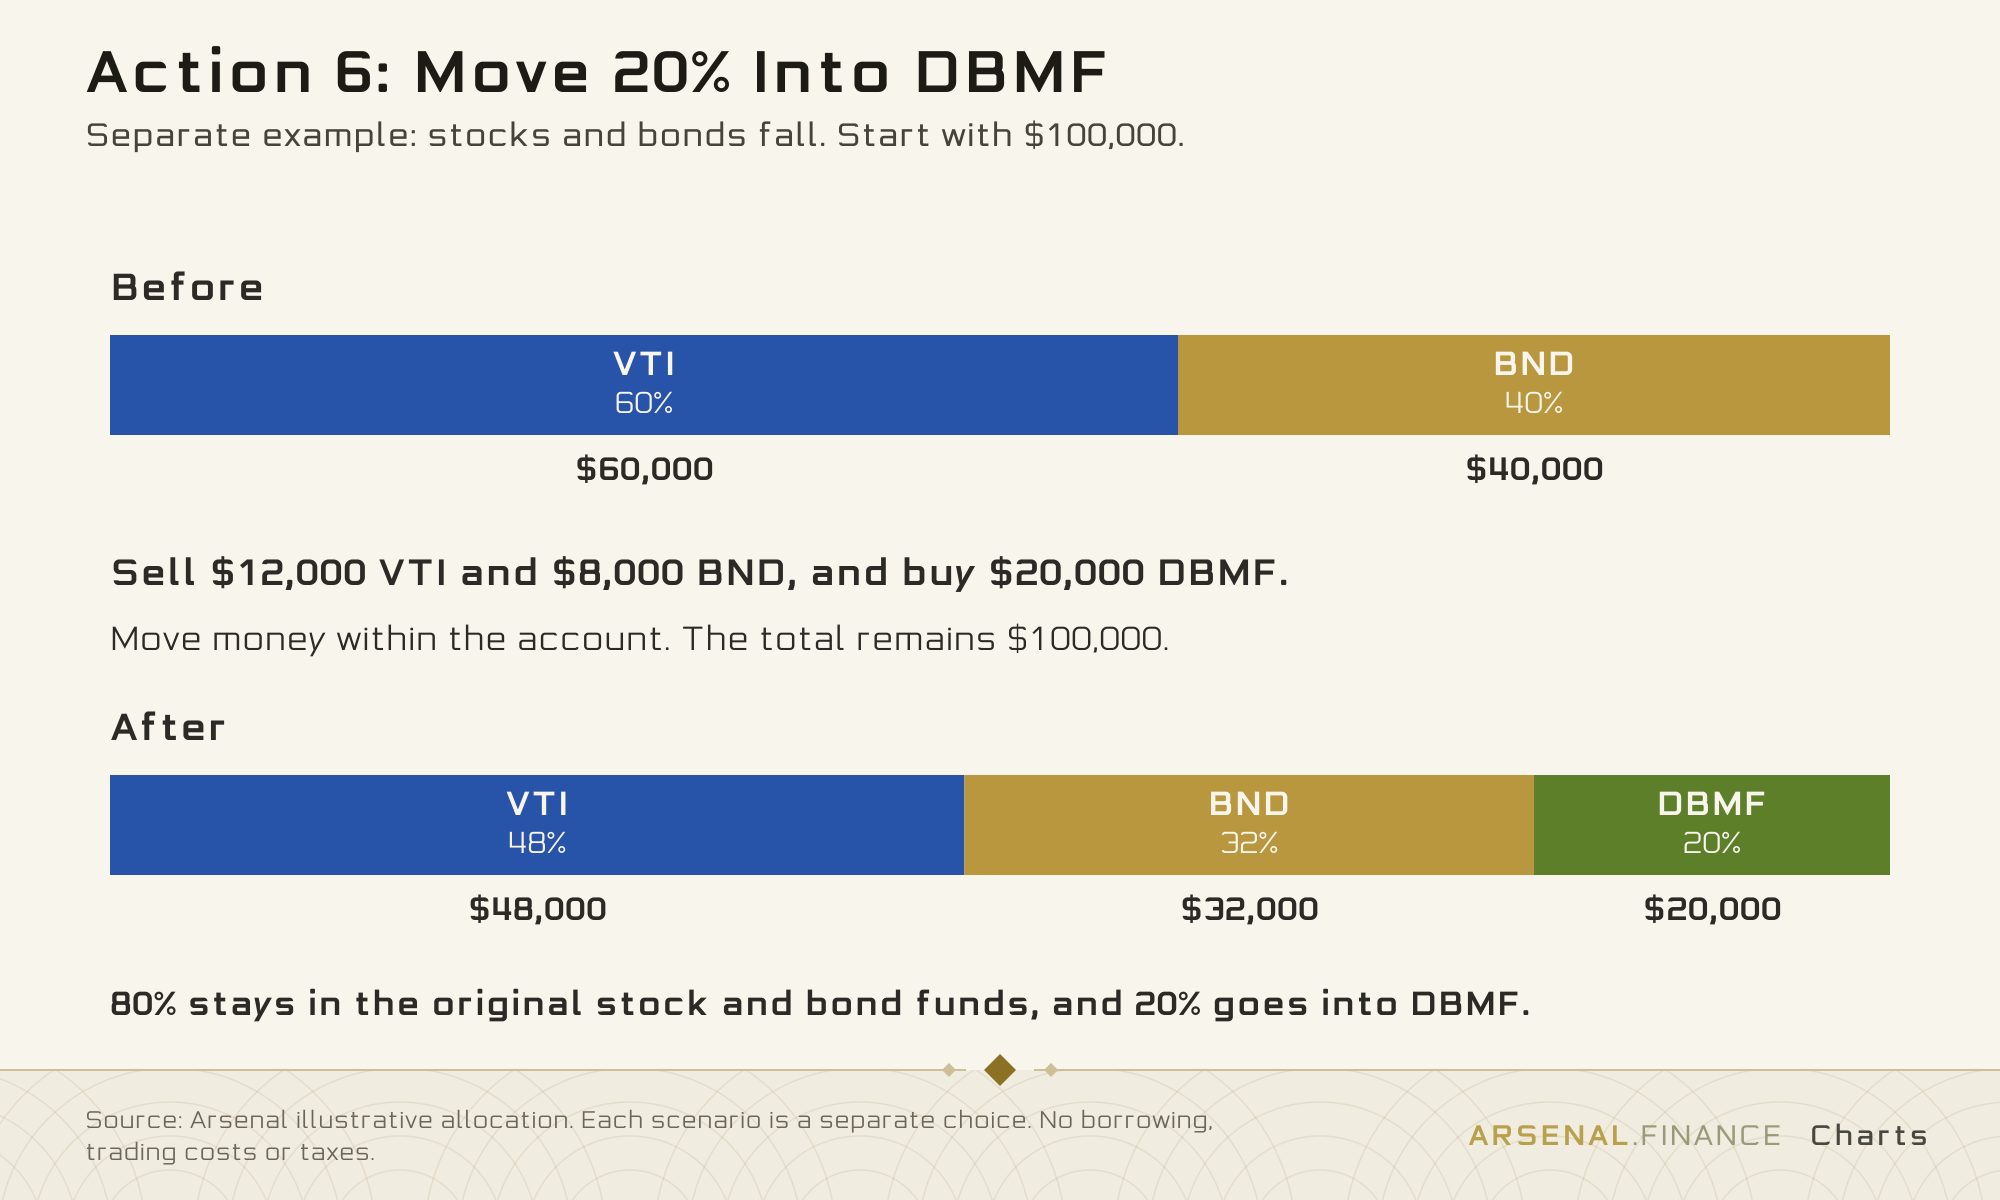
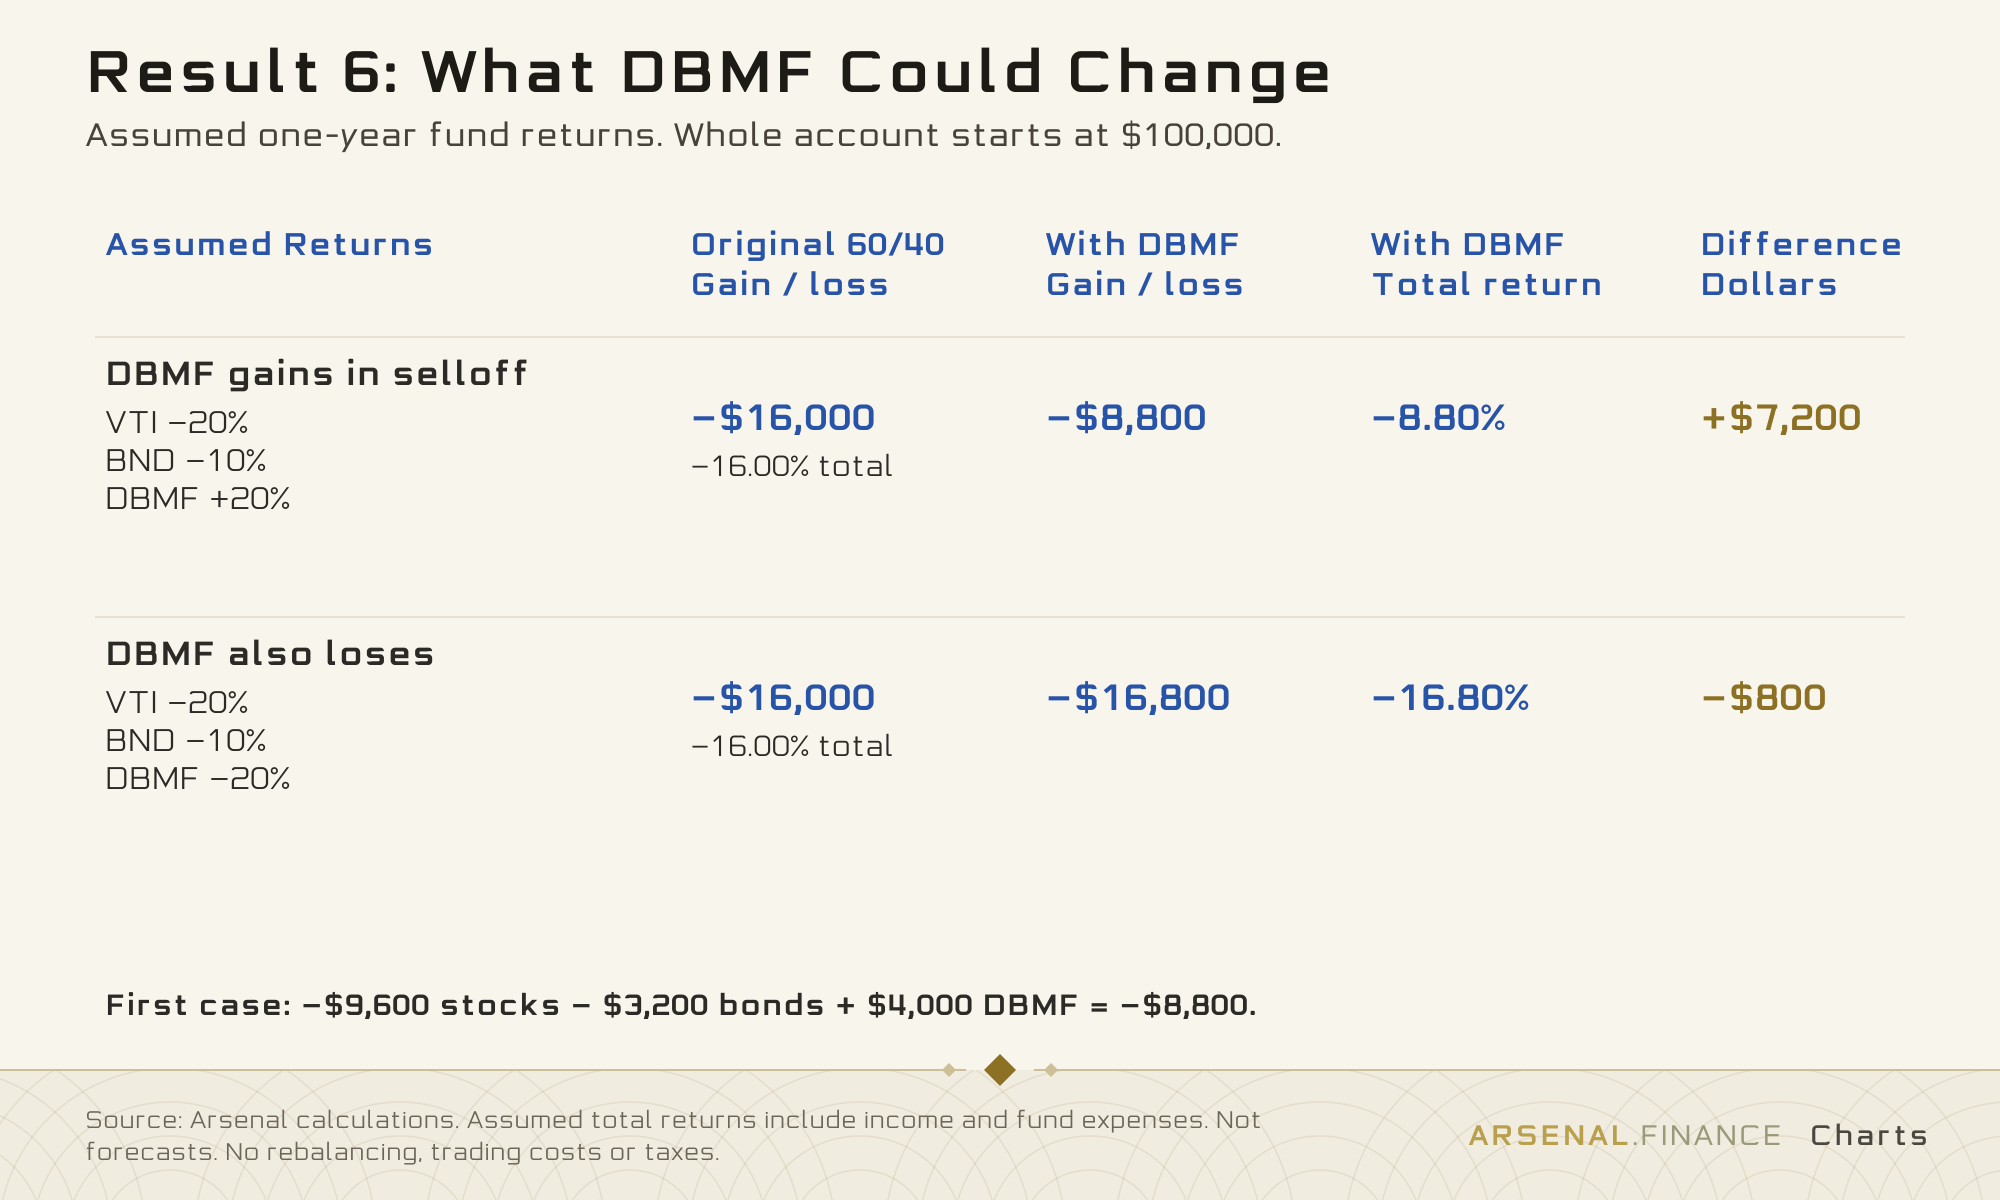
It still needs the right positions. Here, a DBMF gain cuts the account loss to 8.8%, but a DBMF loss makes it worse at 16.8%.
What happened in an actual bad year?
In 2022, VTI lost 19.50% and BND lost 13.15%, including reinvested income, so the original account lost 16.96%. Using that year’s actual fund returns, a 10% PFIX position would have reduced the loss to 5.87%, while TAIL offered little improvement.
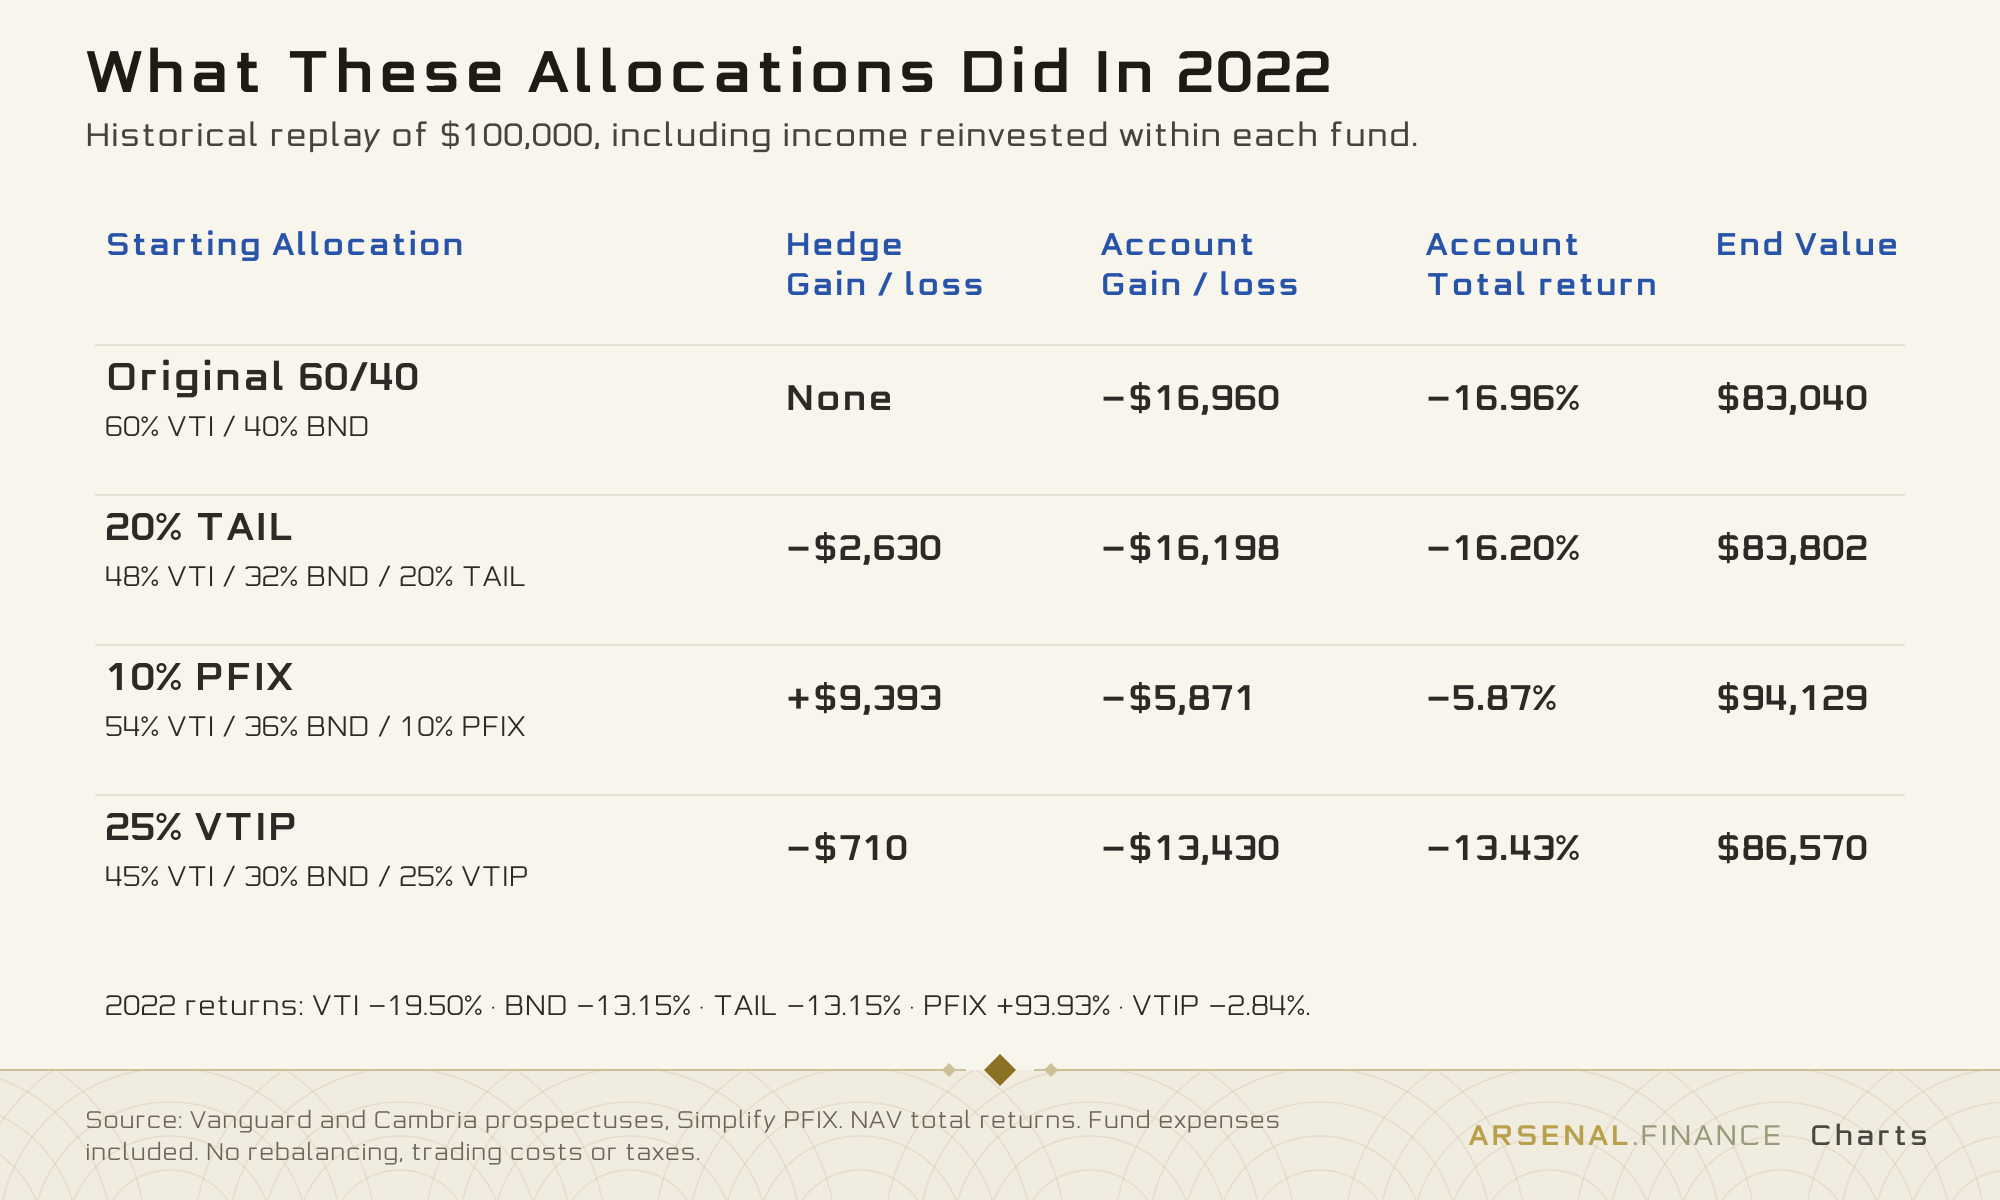
These are comparisons made with hindsight. They assume each allocation was held for all of 2022 with income reinvested within each fund and no shifts between funds. Fund expenses are included, and trading costs and personal taxes are excluded.
Keep most of your money invested and match a temporary hedge to the risk you actually face. Check what it could save and what it could cost, and decide when you will remove it before buying. The Arsenal portfolio backtester can help compare past allocations, so you can judge the effect on the whole account.
Would you like me to dig deeper into hedging and how these funds work? Let me know in the comments.
Sources
Thanks for reading! Subscribe for free to receive new posts and support my work.
Disclaimer: The information above provided by Arsenal.Finance is for educational and informational purposes only and should not be construed as investment, financial, or legal advice. I am not a financial advisor. All investments involve risk, and the past performance of a security or financial product does not guarantee future results or returns. Always conduct your own research or consult with a professional before making any financial decisions.